80- What does each of those dots represent? 60- 40- Summarize the chart, what does it tell you about MI and or grades? 20- 1 Grade Mitotic Index LOO
80- What does each of those dots represent? 60- 40- Summarize the chart, what does it tell you about MI and or grades? 20- 1 Grade Mitotic Index LOO

Chapter15: Adult And Pediatric Dosages Based On Body Weight
Section: Chapter Questions
Problem 5.2P

Related questions
Question
Please Help me with this! THank You!
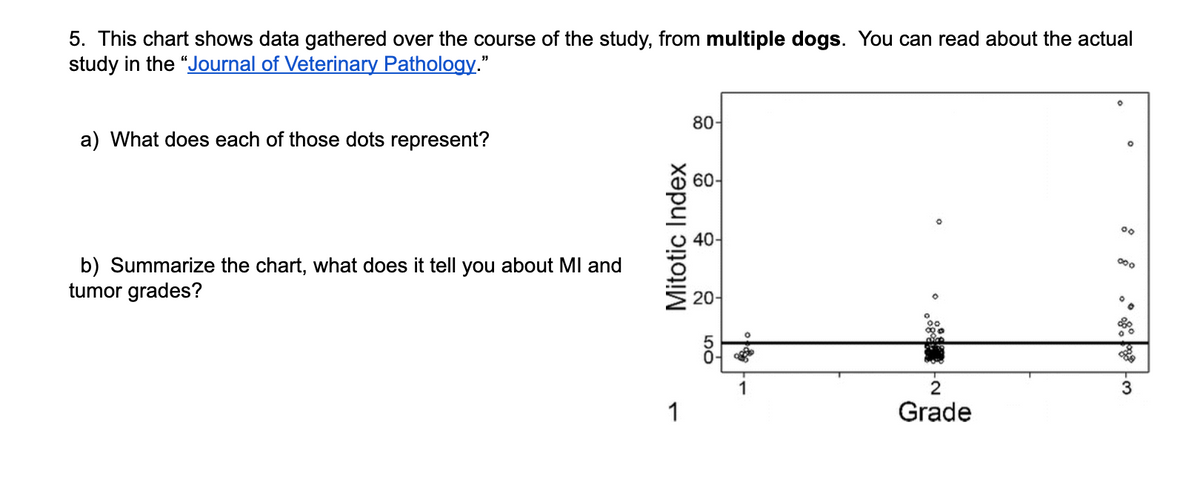
Transcribed Image Text:5. This chart shows data gathered over the course of the study, from multiple dogs. You can read about the actual
study in the "Journal of Veterinary Pathology."
80-
a) What does each of those dots represent?
60-
00
40-
b) Summarize the chart, what does it tell you about MI and
tumor grades?
20-
1
1
Grade
Mitotic Index
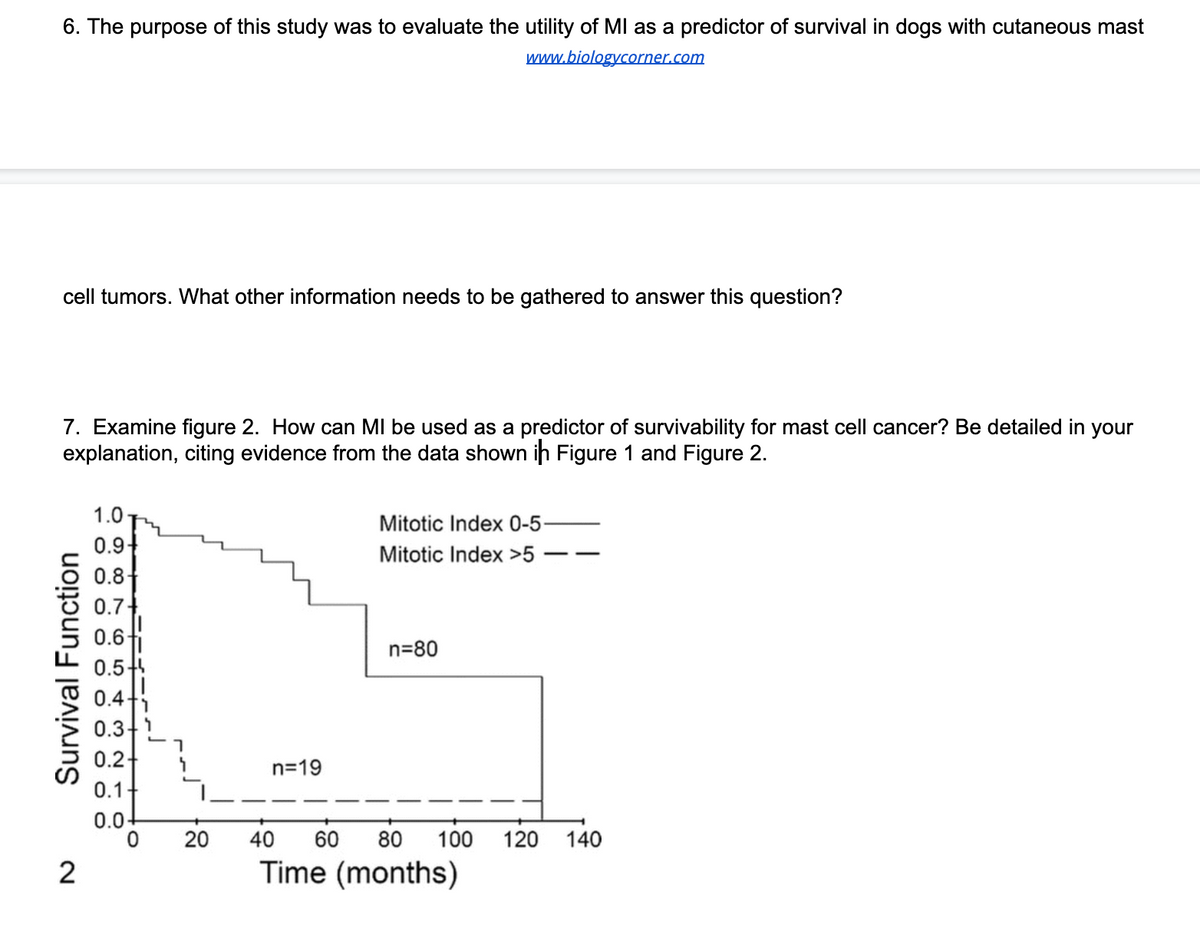
Transcribed Image Text:6. The purpose of this study was to evaluate the utility of MI as a predictor of survival in dogs with cutaneous mast
www.biologycorner.com
cell tumors. What other information needs to be gathered to answer this question?
7. Examine figure 2. How can MI be used as a predictor of survivability for mast cell cancer? Be detailed in your
explanation, citing evidence from the data shown ih Figure 1 and Figure 2.
1.0
Mitotic Index 0-5-
0.9+
0.8-
0.7+
0.6-
0.5+
0.4+
0.3-
0.2+
0.1-
Mitotic Index >5
n=80
n=19
0.0-
20
40
60
80
100
120
140
2
Time (months)
Survival Function
Expert Solution
This question has been solved!
Explore an expertly crafted, step-by-step solution for a thorough understanding of key concepts.

This is a popular solution!

Trending now
This is a popular solution!

Step by step
Solved in 2 steps

Knowledge Booster


Learn more about
Need a deep-dive on the concept behind this application? Look no further. Learn more about this topic, biology and related others by exploring similar questions and additional content below.Recommended textbooks for you

Biology: The Dynamic Science (MindTap Course List)
Biology
ISBN:
9781305389892
Author:
Peter J. Russell, Paul E. Hertz, Beverly McMillan
Publisher:
Cengage Learning

Comprehensive Medical Assisting: Administrative a…
Nursing
ISBN:
9781305964792
Author:
Wilburta Q. Lindh, Carol D. Tamparo, Barbara M. Dahl, Julie Morris, Cindy Correa
Publisher:
Cengage Learning
Biology: The Dynamic Science (MindTap Course List)
Biology
ISBN:
9781305389892
Author:
Peter J. Russell, Paul E. Hertz, Beverly McMillan
Publisher:
Cengage Learning
Comprehensive Medical Assisting: Administrative a…
Nursing
ISBN:
9781305964792
Author:
Wilburta Q. Lindh, Carol D. Tamparo, Barbara M. Dahl, Julie Morris, Cindy Correa
Publisher:
Cengage Learning