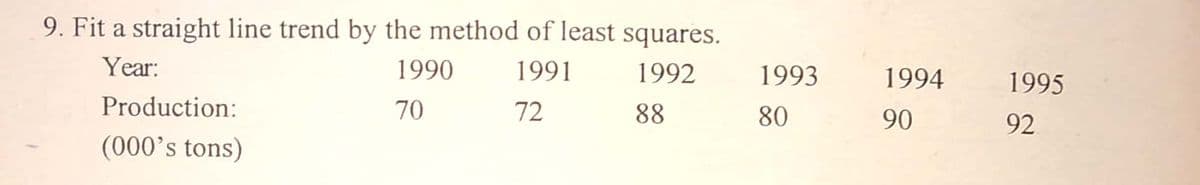
9. Fit a straight line trend by the method of least squares. Year: 1990 1991 1992 1993 1994 1995 Production: 70 72 88 80 90 92 (000's tons)


Q: E. Direction: Consider the problem below. Draw a Venn diagram. Determine whether the event is…
A: Since we know that two events are said to be mutually exclusive if their interactions is zero For…
Q: Consider a family of three children. Find the following probabilities: (a) P(two boys|first born is…
A:
Q: An experiment measures how long mice take to find the cheese in a maze, Y;, and compares it with the…
A: The regression line are used to predict the future variable. It has two coefficients they are slope…
Q: Construct all random samples consisting of three observations from the given data. List all the…
A:
Q: 1. Mario has 45 red chips, 12 blue chips, and 24 white chips. What is the probability that Mario…
A:
Q: .How do I draw a normal form for this extensive form 3-player game?
A:
Q: Example 27. The distribution of monthly wages (in Rs.) of 40 workers in a factory is given below:…
A:
Q: Aample 29. Draw a less than ogive for the following frequency distribution: 1.Q. 70 - 80 90 – 100 |…
A:
Q: In a county male height is normally distributed with a mean of 175 cm and a standard deviation of 6…
A:
Q: Probability of Compound Events. In a class of 30 students, 15 are history buffs and 21 are math…
A: Given: There are 30 students 15 are history buffs 21 are math greeks They all like at least one of…
Q: There are 22 students in a fraternity. In how many ways can a committee of 6 students be selected?…
A: Given that Number of students=22 Number of students selected=6
Q: A company has 10 software engineers and 6 civil engineers. In how many ways can they be seated…
A:
Q: 1. Obtain the regression of Y on X a is 50. 'from the following table and estimate the blood…
A:
Q: 7 A card is chosen at random from an ordinary deck of 52 cards. What is the probability that the…
A: Given
Q: Find 95% confidence interval for the population mean, if the sample size is 40, the sample mean is…
A:
Q: Q. 30 Define Marshall-Edge worth price index.
A:
Q: GIVES THE SERVICE LOCAL WEATHER 60% RAIN FOR EACH OF THE CHANCE OF NEXT TWO DAYs. POSSIBLE OUT COMES…
A: Given that n=2 , p=60%=0.60 , q=1-p=1-0.60=0.40 X~Binomial(n=2,p=0.60)
Q: A normal population has mean u 54 and standard deviation o = 7. What is the 84 th percentile of the…
A:
Q: he weight of the package is normally distributed with a mean of 650 g and a standard deviation of 42…
A: Given that The weight of the package is normally distributed with a mean of 650 g and a standard…
Q: . If X is a normally distributed random variable with a mean of 235 Find the standard deviation…
A:
Q: (b) Is there a significant difference in the average testosterone levels between obese and health…
A: Hypothesis test are used to measure the significance between the sample and population. There are…
Q: 1) In a simple non-redundant unit with A1 = 0.1 failures per 1000 h: What is the syste reliability…
A: Given Information: λ1=0.1 , t =1000
Q: 21 Which of the following is equivalent to P(n+1, 3)? O n - n O n? +n O n + 2n – n О Зп + 3
A:
Q: Use the normal approximation to the binomial to find the probability for n=,10 p=0.5 and X≥8. Round…
A:
Q: Consider the PINS made from exactly three symbols chosen from the 26 letters of the alphabet with…
A: Given that the pin made from the exactly three symbol chosen form the 26 letters of alphabet with…
Q: (b) Use rules of variance to obtain an expression for the variance and standard deviation (standard…
A: Variance is the measure of dispersion. It is calculated by taking sum of square difference from the…
Q: president, a treasurer and a secretary are to be chosen in an organization having 30 members. How…
A: 30 members, President, a treasurer and a secretary are to be selected. If a certain group of 3…
Q: A population consists of the following values 2, 4, 6, 8 and 10. List down all the possible samples…
A: Note: Hi, thank you for the question. As per our company guideline we are supposed to answer only…
Q: The admission committee of AUCA enrolls 76% of those who took the exam. If the scores follow a…
A:
Q: (b) Let the continuous random variable X has probability density function as follows, (k(x+2)², -2<x…
A: For the given data Find ( i ) K= ? ( ii ) P (-1<=x<= 1 ) = ?
Q: - Determine the mode graphically from the following series: Week wages in Rupees Number of workers…
A:
Q: Determine mode graphically and verify this value with actual calculations. Profits (Rs) No. of shops…
A:
Q: Consider the following binomial probability expression below. The number of trials, the number of…
A: Given that
Q: Simplify the following using De Morgan's and justify your answers using Venn Diagram a. ((A' n B)' U…
A: We have to simplify De Morgan's We have to varify with using venn diagram.
Q: (b) Let the continuous random variable X has probability density function as follows, rk(x+2)2, -2…
A: Solution
Q: Refer to the Venn diagram for events a abs B in an equally likely sample space S. Find the indicated…
A:
Q: 4. If a license plate pattern is LLL NNNN where L is a letter and N is a number digit, how many…
A: Permutations: A permutation of different objects taken r at a time is an arragement of r out of the…
Q: selected such that at least one boy should be there? b. From a group of 7 men and 6 women, five…
A: The study of probability provides a mathematical framework for such assertions and is essential in…
Q: It has long been stated that the mean temperature of humans is 98.6°F. However, two researchers…
A:
Q: Construct all random samples consisting of three observations from the given data. List all the…
A: Let all possible random samples of the same size are considered that have been drawn from the same…
Q: Show that :(i) Fishers IN. lies between Laspeyre's and Pagsche's Inder numbers.
A:
Q: Consider the two-digit positive integers 10, 11, 12, ., 99. What is the probability that a randomly…
A:
Q: Of nine executives in a business firm, three are married, four have never married, and two are…
A:
Q: a. Out of 7 consonants and 4 vowels, how many words of 3 consonants and 2 vowels can be formed? b.…
A:
Q: A large normally distributed population has a mean of 502 and a standard deviation of 25. If the…
A:
Q: Calculate the probability that a batch is rejected. (ii) If 1,200 bathces were inspected how many…
A:
Q: We are interested in the relationship between mid-term exam scores and final exam scores. The Final…
A: From the above output First option is correct (71.391, 71.768)
Q: From a group of 7 men and 6 women, five persons are to be selected to form a committee so that there…
A:
Q: Two hundred pre-engineering students have their midterm grades in the statistics, assuming normally…
A:
Q: POPULATIO CERTAIN COUNTRY LAST YEAR, THE NuMBER OF DEATHS DUE TO ALZHEI MERS DISEAS€ 40, 250. DEATH…
A: Proportion of something in a population is the ratio of the number of things having that particular…

Step by step
Solved in 2 steps with 2 images

- The shape of the mean-variance frontier that results from the combination of a riskless and arisky asset is…..:a. Is U-shaped, tilted 90 degrees clockwise.b. Is a straight line passing from the mean-variance points of the two assets.c. Is a hyperbola.d. Consists of two straight lines, each connecting one of the two assets to a risk-freeportfolioThe Abendigo Division of Block C Enterprises has a product designed to operate for 1000 hours with a failure rate of 2.2%. Calculate the Mean Time to Failure.Calculate Pearson’s coefficient of skewness. Hence, describe the shape of thedistribution of the waiting time for counter A and B.
- An independent research group is interested in showing that the percentage of babies delivered through the the Cesarian section decreases. For the past years, 20% of the babies were delivered through the Cesarian section. The research group randomly inspects the medical records of 144 births and finds that 25 of the births were by Cesarian section. Can the research group conclude that the percent of births by Cesarian section has decreased at 5% level of significance?Define the Distributed Lag Model with Additional Lags and AR(p) Errors?Enter the equation of the least‑squares regression line, with the numerical values rounded to three decimal places and ?� as the explanatory variable. (If you are using CrunchIt, adjust the default precision under Preferences as necessary.
- Texas Instruments produces computer chips in production runs of 1 million at a time. It has found that the fraction of defective modules can be very different in different production runs. These differences are caused by small variations in the set-up of each production run. Managers have observed that defective rates are roughly triangular, with a lower bound of 0%, and an upper bound of 50%. Defects more likely to be near 10% than any other single value in their range. Now suppose that we have taken a sample of 10 modules, and 2 of them are defective. i. What is the conditional probability of a defective rate less than 25% in this production run?ii. For what number M would you say that the defective rate is equally likely to be above or below M?The proportion p of residents in a community who recycle has traditionally been 60% . A policy maker claims that the proportion is less than 60% now that one of the recycling centers has been relocated. If 126 out of a random sample of 215 residents in the community said they recycle, is there enough evidence to support the policy maker's claim at the 0.10 level of significance? Perform a one-tailed test. Then complete the parts below. Carry your intermediate computations to three or more decimal places. (If necessary, consult a list of formulas.) (a) State the null hypothesis H0 and the alternative hypothesis H1 . H0: H1: (b) Determine the type of test statistic to use. ▼(Choose one) (c) Find the value of the test statistic. (Round to three or more decimal places.) (d) Find the p-value. (Round to three or more decimal places.) (e) Is there enough evidence to support the policy maker's claim that the…Texas Instruments produces computer chips in production runs of 1 million at a time. It has found that the fraction of defective modules can be very different in different production runs. These differences are caused by small variations in the set-up of each production run. Managers have observed that defective rates are roughly triangular, with a lower bound of 0%, and an upper bound of 50%. Defects more likely to be near 10% than any other single value in their range. (a) Before we test any modules, let’s understand the distribution of de- fects. Simulate at least 2,000 draws from the triangular distribution and answer the following questions. 1 What is the probability of a defect rate less than 0.25 in this production run? 2 For what number M would you say that the defective rate is equally likely to be above or below M? 3 What is the probability that we will find exactly two defective modules when we test 10 modules from this production run? (b) Now suppose that we have taken a…
- In Austria ,The amount of money spent on the restoration of a sanctuary and the distinct kangaroo populations present appeared to have negative correlations For investigation of this onserved assocaition ,what can a resecher do to begin his research 1Conduct an experiment 2Calculate the squares of coreealtion coefficient 3Calculate the least squares regression line 4 calculate the corelation coefficient Explain answer in 1 or 2 linesThe proportion p of residents in a community who recycle has traditionally been 60%. A policy maker claims that the proportion is less than 60% now that one of the recycling centers has been relocated. If 133 out of a random sample of 230 residents in the community said they recycle, is there enough evidence to support the policy maker's claim at the 0.10 level of significance? Perform a one-tailed test. Then complete the parts below.Carry your intermediate computations to three or more decimal places. (If necessary, consult a list of formulas.) Find the value of the test statistic and round to 3 or more decimal places. (I have posted a picture of an example problem and the equation to use, with the correct answer as every expert I have asked thus far has gotten this problem wrong.) A. Find the value of the test statistic. (Round to three or more decimal places.) B. Find the critical value. (Round to three or more decimal places.) C. Is there enough evidence to support the policy…The proportion p of residents in a community who recycle has traditionally been 60%. A policy maker claims that the proportion is less than 60% now that one of the recycling centers has been relocated. If 133 out of a random sample of 230 residents in the community said they recycle, is there enough evidence to support the policy maker's claim at the 0.10 level of significance? Perform a one-tailed test. Then complete the parts below.Carry your intermediate computations to three or more decimal places. (If necessary, consult a list of formulas.) (For Z test statistics) Find the value of the test statistic and round to 3 or more decimal places. (I have posted a picture of an example problem and the equation to use, with the correct answer as every expert I have asked thus far has gotten this problem wrong.) A. Find the value of the test statistic. (Round to three or more decimal places.) B. Find the critical value. (Round to three or more decimal places.) C. Is there enough evidence to…