9. The table below shows the data collected on a highway during a speed study. Develop the frequency histogram and the frequency distribution of the data and determine: (i) The arithmetic mean speed (49.5 km/h) (ii) The standard deviation (6.5 km/h) (iii) The median speed (49 km/h) (iv) The mode or modal speed (49 km/h) (v) The 85th-percentile speed (54 km/h)
9. The table below shows the data collected on a highway during a speed study. Develop the frequency histogram and the frequency distribution of the data and determine: (i) The arithmetic mean speed (49.5 km/h) (ii) The standard deviation (6.5 km/h) (iii) The median speed (49 km/h) (iv) The mode or modal speed (49 km/h) (v) The 85th-percentile speed (54 km/h)

Traffic and Highway Engineering
5th Edition
ISBN:9781305156241
Author:Garber, Nicholas J.
Publisher:Garber, Nicholas J.
Chapter4: Traffic Engineering Studies
Section: Chapter Questions
Problem 17P

Related questions
Question
100%
Hello, can i get some help please?
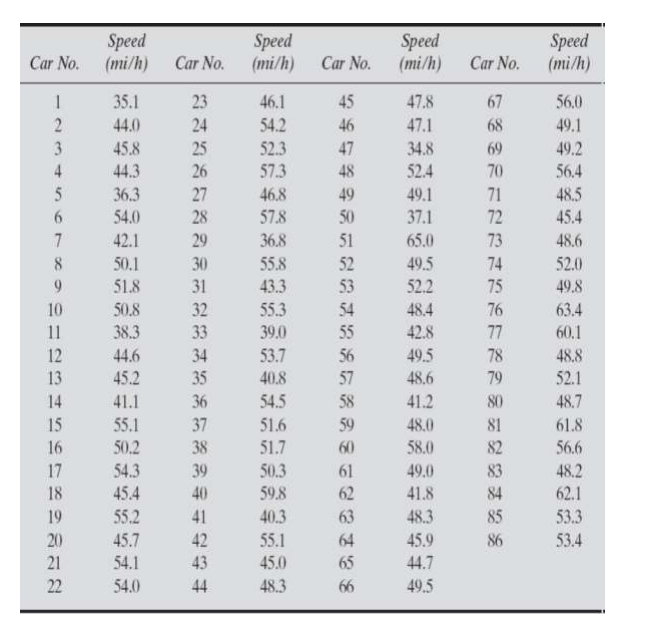
Transcribed Image Text:Car No.
1
2
3
4
5
6
7
8
9
10
11
12
13
14
15
16
17
18
19
20
21
22
Speed
(mi/h)
35.1
44.0
45.8
44.3
36.3
54.0
42.1
50.1
51.8
50.8
38.3
44.6
45.2
41.1
55.1
50.2
54.3
45.4
55.2
45.7
54.1
54.0
Car No.
23
24
25
26
27
28
29
30
31
32
33
34
35
36
37
38
39
40
41
42
43
44
Speed
(mi/h)
46.1
54.2
52.3
57.3
46.8
57.8
36.8
55.8
43.3
55.3
39.0
53.7
40.8
54.5
51.6
51.7
50.3
59.8
40.3
55.1
45.0
48.3
Car No.
45 46
47
48
49
50
51
52
53
54
55
56
57
58
59
60
61
62
63
64
65
66
Speed
(mi/h)
47.8
47.1
34.8
52.4
49.1
37.1
65.0
49.5
52.2
48.4
42.8
49.5
48.6
41.2
48.0
58.0
49.0
41.8
48.3
45.9
44.7
49.5
Car No.
67
68
69
70
71
2 5 4 75 76 7 78
72
73
74
77
79
80 2 S 4
80
81
85
86
Speed
(mi/h)
56.0
49.1
49.2
56.4
48.5
45.4
48.6
52.0
49.8
63.4
60.1
48.8
52.1
48.7
61.8
56.6
48.2
62.1
53.3
53.4
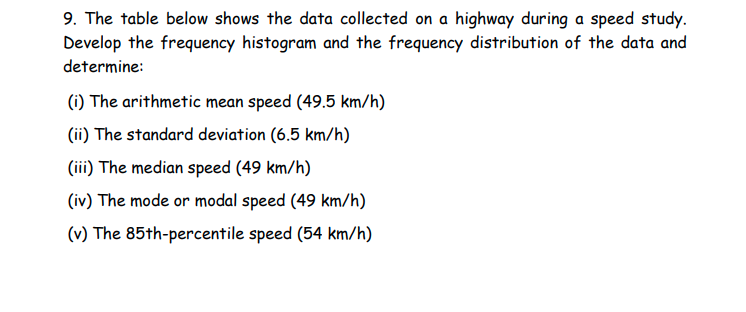
Transcribed Image Text:9. The table below shows the data collected on a highway during a speed study.
Develop the frequency histogram and the frequency distribution of the data and
determine:
(i) The arithmetic mean speed (49.5 km/h)
(ii) The standard deviation (6.5 km/h)
(iii) The median speed (49 km/h)
(iv) The mode or modal speed (49 km/h)
(v) The 85th-percentile speed (54 km/h)
Expert Solution
This question has been solved!
Explore an expertly crafted, step-by-step solution for a thorough understanding of key concepts.

Step by step
Solved in 6 steps with 5 images

Knowledge Booster


Learn more about
Need a deep-dive on the concept behind this application? Look no further. Learn more about this topic, civil-engineering and related others by exploring similar questions and additional content below.Recommended textbooks for you
Traffic and Highway Engineering
Civil Engineering
ISBN:
9781305156241
Author:
Garber, Nicholas J.
Publisher:
Cengage Learning
Traffic and Highway Engineering
Civil Engineering
ISBN:
9781305156241
Author:
Garber, Nicholas J.
Publisher:
Cengage Learning