A-1 BETA COEFFICIENTS AND RATES OF RETURN You are given the following set of data: Historical Rates of Return (r) Year Stock Y(F,) NYSE (F.) 1 3.0% 4.0% 18.2 14.3 9.1 19.0 (6.0) (14.7) (15.3) (26.5) 6. 33.1 37.2 6.1 23.8 8. 3.2 (7.2) 9. 14.8 6.6 10 24.1 20.5 11 18.0 30.6 Mean 9.8% 9.8% 13.8 19.6 a. Construct a scatter diagram graph (on graph paper) showing the rela- tionship between returns on Stock Y and the market, as shown in
A-1 BETA COEFFICIENTS AND RATES OF RETURN You are given the following set of data: Historical Rates of Return (r) Year Stock Y(F,) NYSE (F.) 1 3.0% 4.0% 18.2 14.3 9.1 19.0 (6.0) (14.7) (15.3) (26.5) 6. 33.1 37.2 6.1 23.8 8. 3.2 (7.2) 9. 14.8 6.6 10 24.1 20.5 11 18.0 30.6 Mean 9.8% 9.8% 13.8 19.6 a. Construct a scatter diagram graph (on graph paper) showing the rela- tionship between returns on Stock Y and the market, as shown in

Financial Management: Theory & Practice
16th Edition
ISBN:9781337909730
Author:Brigham
Publisher:Brigham
Chapter2: Financial Statements, Cash Flow,and Taxes
Section: Chapter Questions
Problem 21SP: Begin with the partial model in the file Ch02 P21 Build a Model.xlsx on the textbooks Web site. a....

Related questions
Question
Transcribed Image Text:l Turk Telekom
11:27
ni %40
bartleby.com
שיגסרב
/ Finance / Q&A Library / Finance Question
e Question
actually been 0%. What would the new beta be, based on the most
recent 11 years of data (i.e., Years 2 through 12)? Does this beta seem
reasonable-that is, is the change in beta consistent with the other
facts given in the problem?
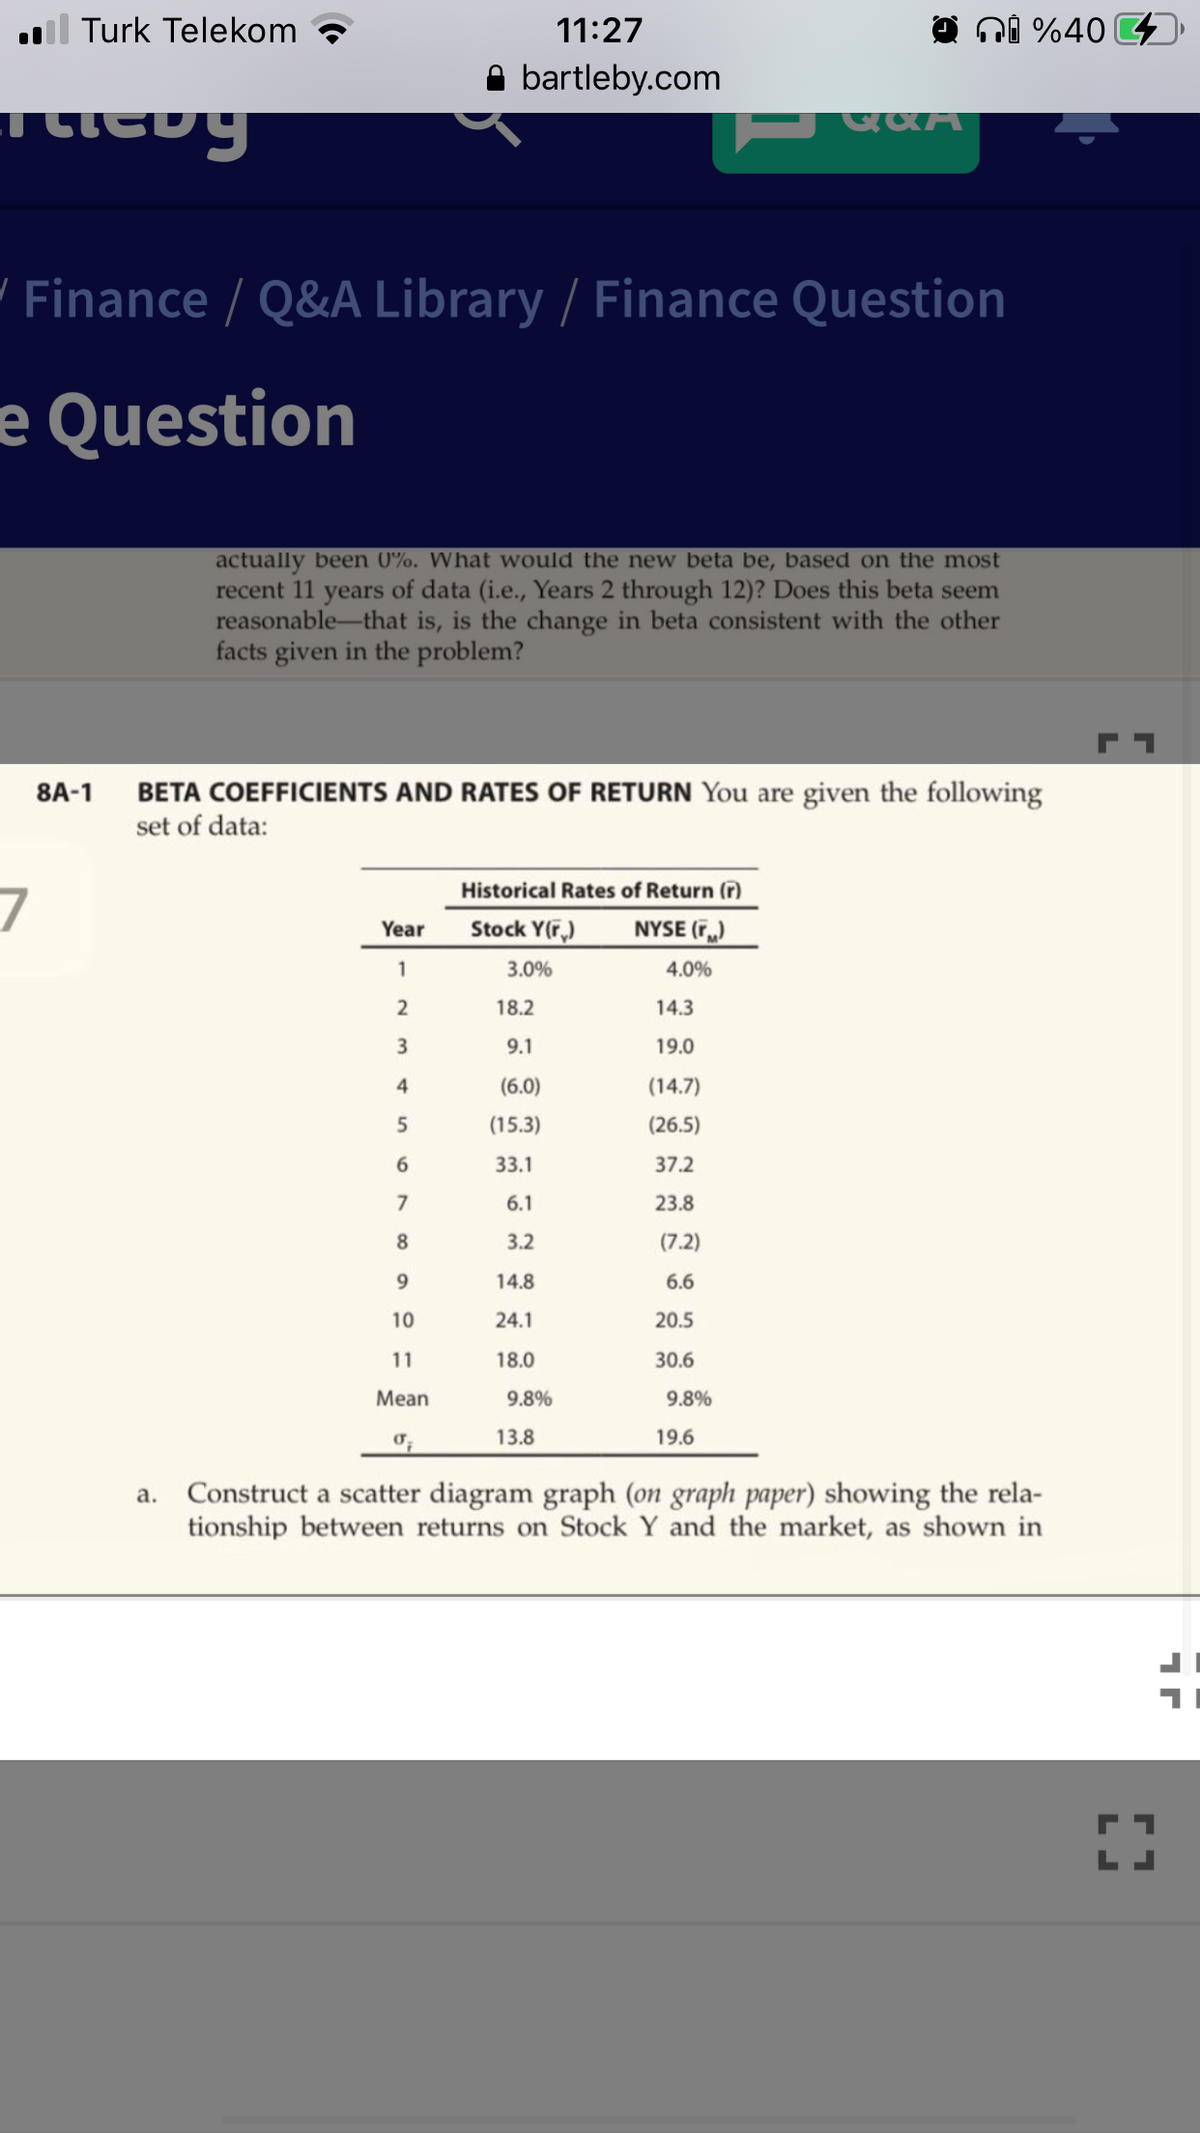
BETA COEFFICIENTS AND RATES OF RETURN You are given the following
set of data:
8A-1
7
Historical Rates of Return (r)
Stock Y(F,)
NYSE (r.)
Year
1
3.0%
4.0%
18.2
14.3
3
9.1
19.0
4
(6.0)
(14.7)
(15.3)
(26.5)
33.1
37.2
7
6.1
23.8
8.
3.2
(7.2)
14.8
6.6
10
24.1
20.5
11
18.0
30.6
Mean
9.8%
9.8%
13.8
19.6
a. Construct a scatter diagram graph (on graph paper) showing the rela-
tionship between returns on Stock Y and the market, as shown in
Transcribed Image Text:l Turk Telekom
11:27
ni %40 4
A bartleby.com
ance / Q&A Library / Finance Question
uestion
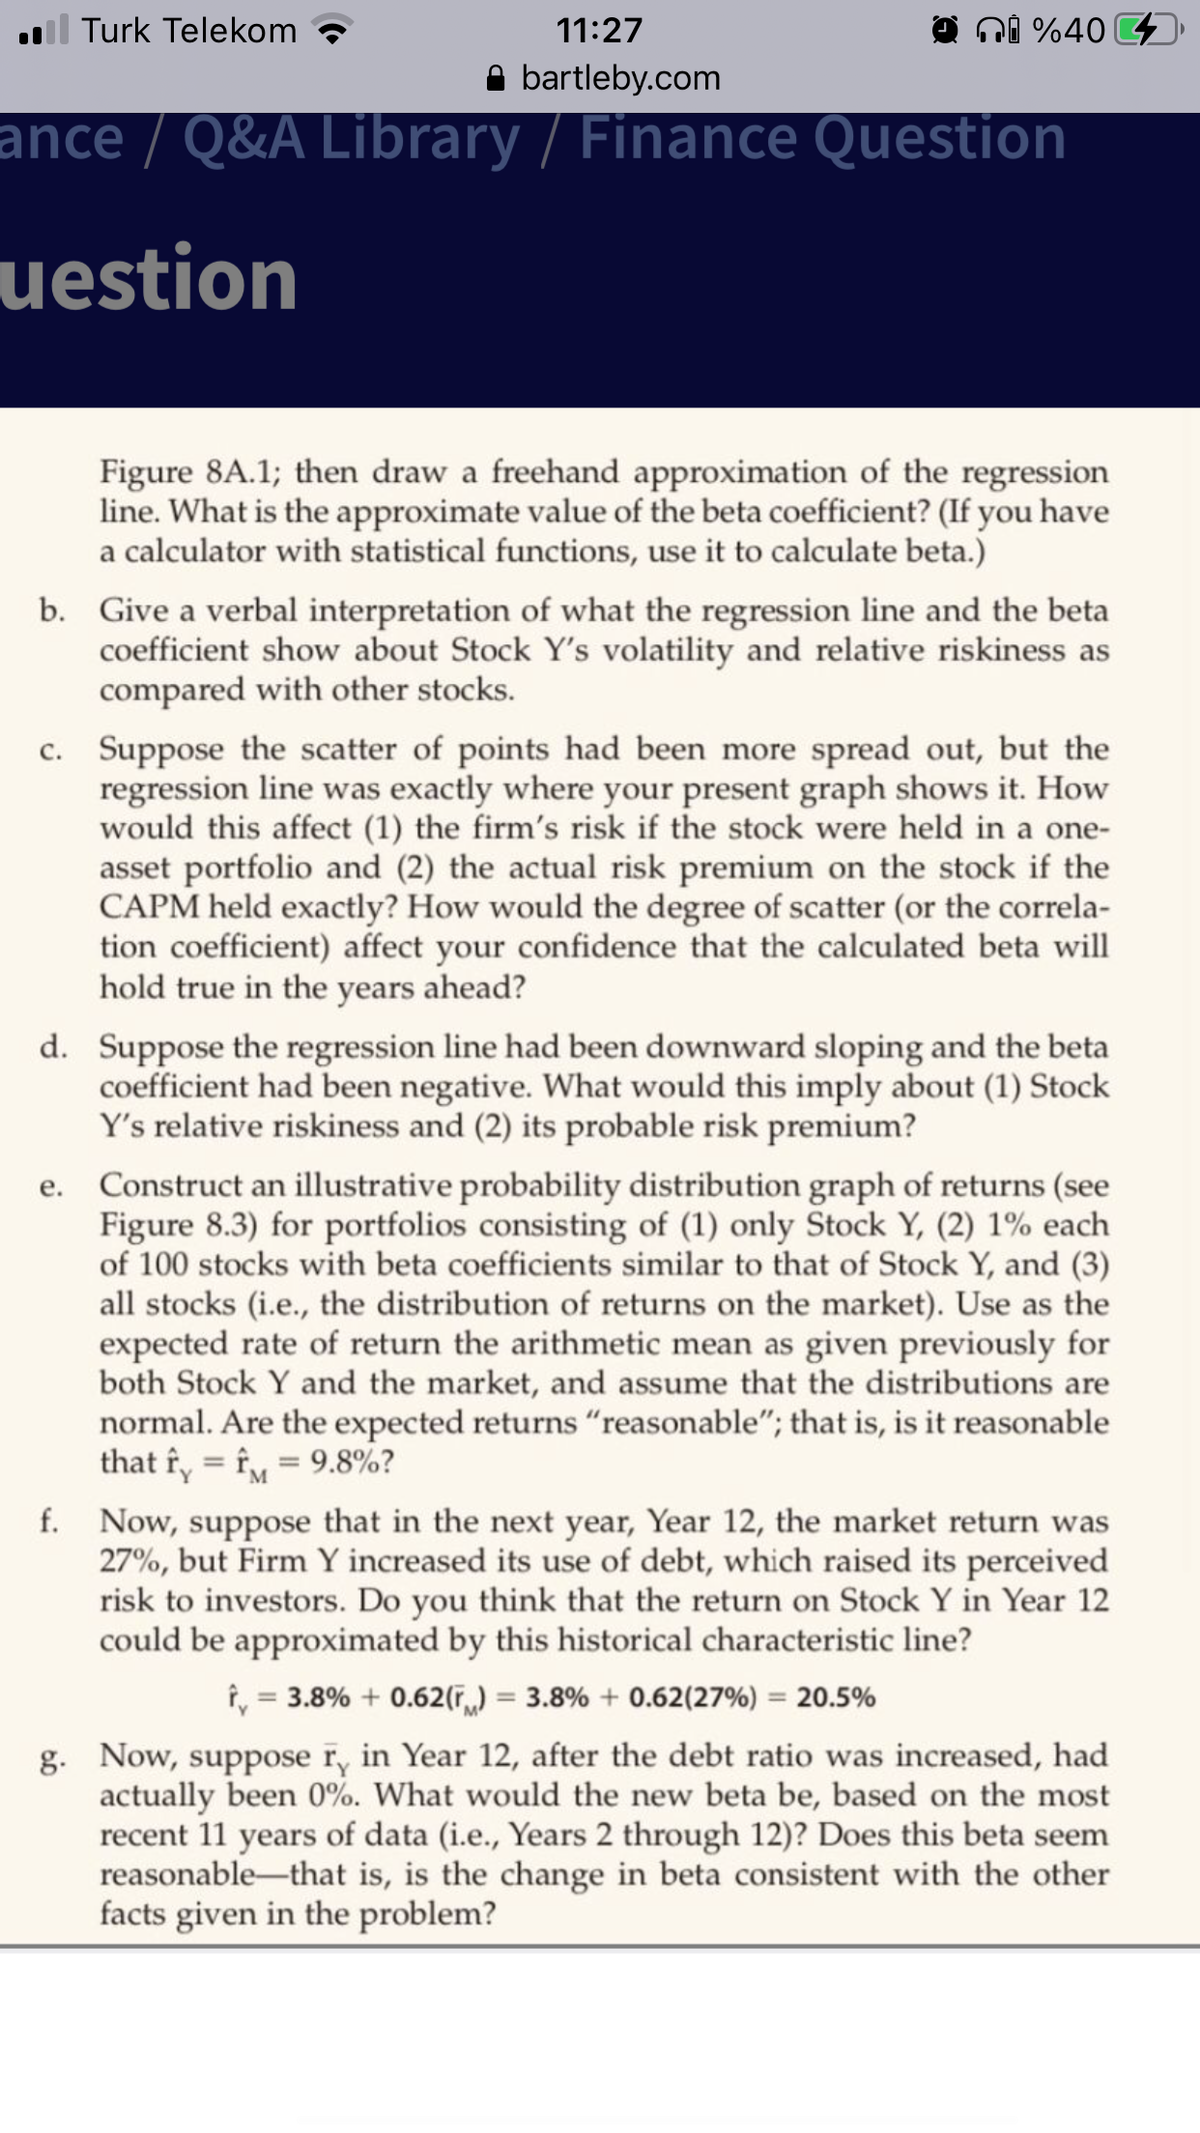
Figure 8A.1; then draw a freehand approximation of the regression
line. What is the approximate value of the beta coefficient? (If you have
a calculator with statistical functions, use it to calculate beta.)
b. Give a verbal interpretation of what the regression line and the beta
coefficient show about Stock Y's volatility and relative riskiness as
compared with other stocks.
c. Suppose the scatter of points had been more spread out, but the
regression line was exactly where your present graph shows it. How
would this affect (1) the firm's risk if the stock were held in a one-
asset portfolio and (2) the actual risk premium on the stock if the
CAPM held exactly? How would the degree of scatter (or the correla-
tion coefficient) affect your confidence that the calculated beta will
hold true in the years ahead?
d. Suppose the regression line had been downward sloping and the beta
coefficient had been negative. What would this imply about (1) Stock
Y's relative riskiness and (2) its probable risk premium?
Construct an illustrative probability distribution graph of returns (see
Figure 8.3) for portfolios consisting of (1) only Stock Y, (2) 1% each
of 100 stocks with beta coefficients similar to that of Stock Y, and (3)
all stocks (i.e., the distribution of returns on the market). Use as the
expected rate of return the arithmetic mean as given previously for
both Stock Y and the market, and assume that the distributions are
normal. Are the expected returns "reasonable"; that is, is it reasonable
that f, = fM = 9.8%?
е.
f. Now, suppose that in the next year, Year 12, the market return was
27%, but Firm Y increased its use of debt, which raised its perceived
risk to investors. Do you think that the return on Stock Y in Year 12
could be approximated by this historical characteristic line?
î, = 3.8% + 0.62(r,) = 3.8% + 0.62(27%) = 20.5%
g. Now, suppose r, in Year 12, after the debt ratio was increased, had
actually been 0%. What would the new beta be, based on the most
recent 11 years of data (i.e., Years 2 through 12)? Does this beta seem
reasonable-that is, is the change in beta consistent with the other
facts given in the problem?
Expert Solution
This question has been solved!
Explore an expertly crafted, step-by-step solution for a thorough understanding of key concepts.

This is a popular solution!

Trending now
This is a popular solution!

Step by step
Solved in 4 steps with 2 images

Knowledge Booster


Learn more about
Need a deep-dive on the concept behind this application? Look no further. Learn more about this topic, finance and related others by exploring similar questions and additional content below.Recommended textbooks for you