(a) Account for each of the different results found in the temperature regions: above T3; between T2 and T3; between T and T2; below T1, (b) Given that the first excited state of the rotational spectrum of this molecule is at an energy kT. above the ground rotational state, and Te = 64 K, calculate from basic theory the rotational contribution to the specific heat capacity of this gas at 20K at 100K, at 300K.
(a) Account for each of the different results found in the temperature regions: above T3; between T2 and T3; between T and T2; below T1, (b) Given that the first excited state of the rotational spectrum of this molecule is at an energy kT. above the ground rotational state, and Te = 64 K, calculate from basic theory the rotational contribution to the specific heat capacity of this gas at 20K at 100K, at 300K.

Related questions
Question
Transcribed Image Text:(The values marked on the vertical scale corres pond to the height of
the curve in each of the "plateau" regions.)
(a) Account for each of the different results found in the temperature
regions: above T3; between T2 and T3; between T1 and T2; below T1,
(b) Given that the first excited state of the rotational spectrum of
this molecule is at an energy kT, above the ground rotational state, and
Te = 64 K, calculate from basic theory the rotational contribution to the
specific heat capacity of this gas at 20K at 100K, at 300K.
(UC, Berkeley)
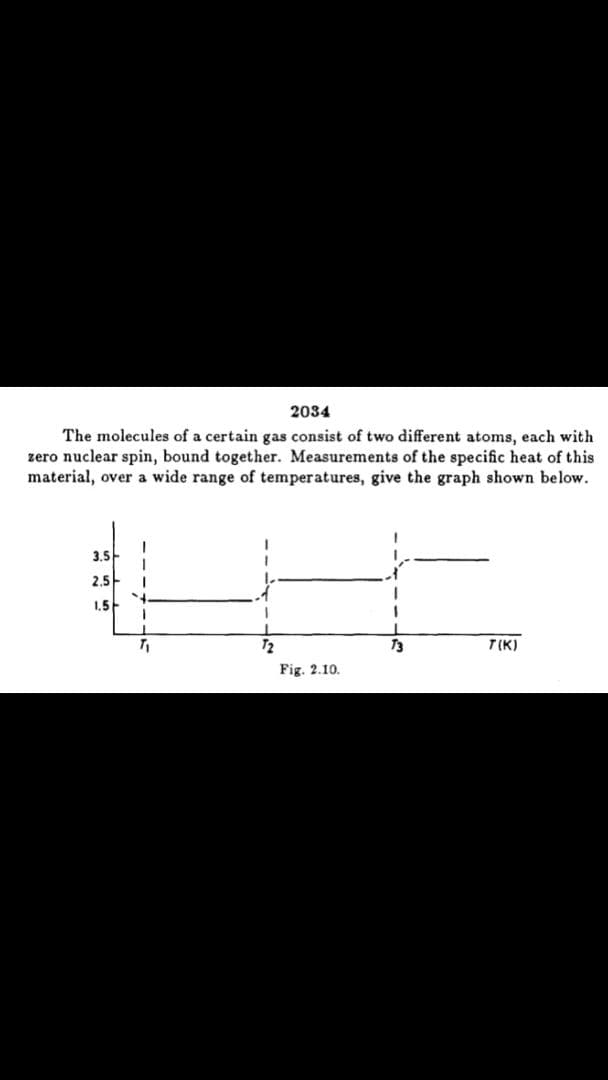
Transcribed Image Text:2034
The molecules of a certain gas consist of two different atoms, each with
zero nuclear spin, bound together. Measurements of the specific heat of this
material, over a wide range of temperatures, give the graph shown below.
3.5
2,5
1,5
72
T3
T(K)
Fig. 2.10.
Expert Solution
This question has been solved!
Explore an expertly crafted, step-by-step solution for a thorough understanding of key concepts.

Step by step
Solved in 2 steps with 2 images
