a b С In a study of the length of time it takes students to travel to TAFE in a country town, a researcher collected data from 22 students. The data in the table gives the distance that the students travel (in kilometres) and the time it takes (in minutes). Distance travelled (km) 15 20 23 25 40 45 50 50 3 7 8 10 10 15 8 8 12 20 25 30 40 50 Time taken (mins) 18 30 15 75 45 60 47 50 80 75 90 5 10 10 10 18 10 30 25 30 42 50 Use your calculator to construct a scatterplot of the time taken against the distance travelled. In this investigation, distance travelled is the explanatory variable. Use the scatterplot to describe the association between the variables in terms of strength, direction and form. Determine the correlation coefficient r for this set of data. Write your answer correct to 3 significant figures.
a b С In a study of the length of time it takes students to travel to TAFE in a country town, a researcher collected data from 22 students. The data in the table gives the distance that the students travel (in kilometres) and the time it takes (in minutes). Distance travelled (km) 15 20 23 25 40 45 50 50 3 7 8 10 10 15 8 8 12 20 25 30 40 50 Time taken (mins) 18 30 15 75 45 60 47 50 80 75 90 5 10 10 10 18 10 30 25 30 42 50 Use your calculator to construct a scatterplot of the time taken against the distance travelled. In this investigation, distance travelled is the explanatory variable. Use the scatterplot to describe the association between the variables in terms of strength, direction and form. Determine the correlation coefficient r for this set of data. Write your answer correct to 3 significant figures.

Related questions
Question
Need some help with this question
Transcribed Image Text:a
b
C
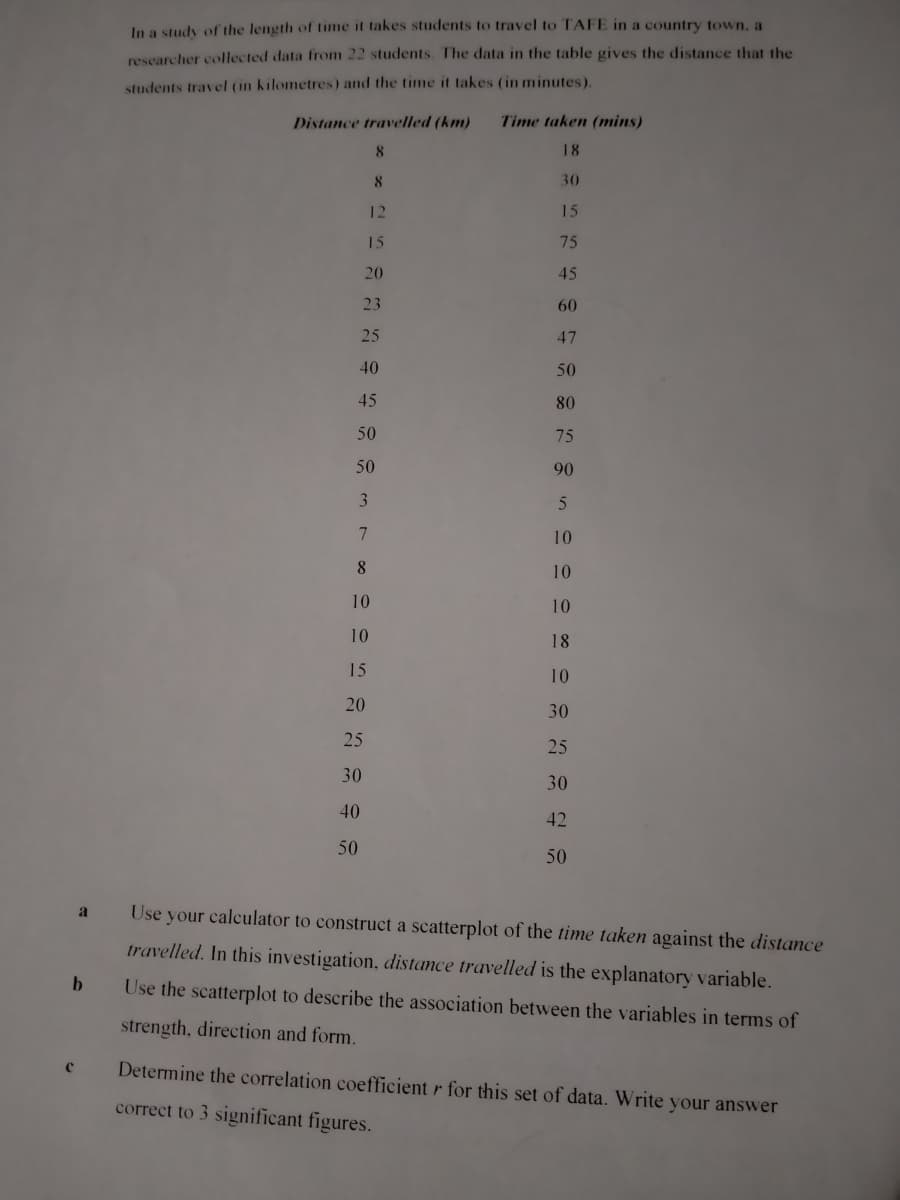
In a study of the length of time it takes students to travel to TAFE in a country town, a
researcher collected data from 22 students. The data in the table gives the distance that the
students travel (in kilometres) and the time it takes (in minutes).
Distance travelled (km)
8
20
23
25
40
45
50
50
3
7
8
10
10
15
8
12
15
20
25
30
40
50
Time taken (mins)
18
30
15
75
45
60
47
50
80
75
90
5
10
10
10
18
10
30
25
30
42
50
Use your calculator to construct a scatterplot of the time taken against the distance
travelled. In this investigation, distance travelled is the explanatory variable.
Use the scatterplot to describe the association between the variables in terms of
strength, direction and form.
Determine the correlation coefficient for this set of data. Write your answer
correct to 3 significant figures.
Expert Solution
This question has been solved!
Explore an expertly crafted, step-by-step solution for a thorough understanding of key concepts.

Step by step
Solved in 3 steps with 1 images
