(a) By looking at the summary output, write down the fitted model. (b) Write down the formula to compute the 95% confidence interval for 3₁. (c) Compute the 95% confidence interval for ₁.
(a) By looking at the summary output, write down the fitted model. (b) Write down the formula to compute the 95% confidence interval for 3₁. (c) Compute the 95% confidence interval for ₁.
Management Of Information Security
6th Edition
ISBN:9781337405713
Author:WHITMAN, Michael.
Publisher:WHITMAN, Michael.
Chapter7: Risk Management: Treating Risk
Section: Chapter Questions
Problem 9RQ

Related questions
Question
Transcribed Image Text:(a) By looking at the summary output, write down the fitted model.
(b) Write down the formula to compute the 95% confidence interval for ₁.
(c) Compute the 95% confidence interval for 3₁.
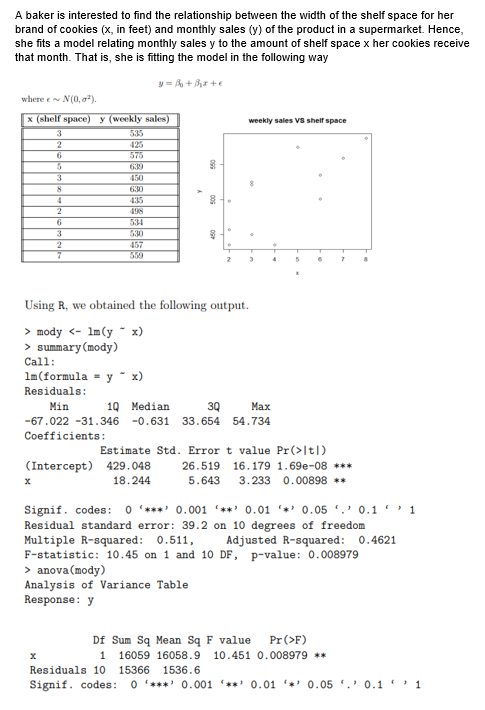
Transcribed Image Text:A baker is interested to find the relationship between the width of the shelf space for her
brand of cookies (x, in feet) and monthly sales (y) of the product in a supermarket. Hence,
she fits a model relating monthly sales y to the amount of shelf space x her cookies receive
that month. That is, she is fitting the model in the following way
y=B+₂x+e
where ~ N(0,0¹).
x (shelf space) y (weekly sales)
weekly sales VS shelf space
3
2
6
575
5
3
450
8
630
4
435
2
498
6
534
3
530
2
457
7
2
3
5
7
Using R, we obtained the following output.
> mody <- 1m (y - x)
> summary (mody)
Call:
lm (formula y - x)
Residuals:
Min
10 Median
3Q
Max
-67.022 -31.346 -0.631 33.654 54.734
Coefficients:
(Intercept) 429.048
26.519 16.179 1.69e-08 ***
x
18.244
5.643 3.233 0.00898 **
Signif. codes: 0*** 0.001 **0.01 0.05 0.11
Residual standard error: 39.2 on 10 degrees of freedom
Multiple R-squared: 0.511,
Adjusted R-squared: 0.4621
F-statistic: 10.45 on 1 and 10 DF, p-value: 0.008979
> anova (mody)
Analysis of Variance Table
Response: y
X
1
Df Sum Sq Mean Sq F value Pr (>F)
16059 16058.9 10.451 0.008979 **
Residuals 10 15366 1536.6
Signif. codes: 0 '*** 0.001 '**' 0.01 0.05. 0.11
8
4
Estimate Std. Error t value Pr(>|t|)
.
Expert Solution
This question has been solved!
Explore an expertly crafted, step-by-step solution for a thorough understanding of key concepts.

This is a popular solution!

Trending now
This is a popular solution!

Step by step
Solved in 2 steps with 3 images

Knowledge Booster


Learn more about
Need a deep-dive on the concept behind this application? Look no further. Learn more about this topic, computer-science and related others by exploring similar questions and additional content below.Recommended textbooks for you
Management Of Information Security
Computer Science
ISBN:
9781337405713
Author:
WHITMAN, Michael.
Publisher:
Cengage Learning,
Management Of Information Security
Computer Science
ISBN:
9781337405713
Author:
WHITMAN, Michael.
Publisher:
Cengage Learning,