A cantilever beam of IPN 300 section and length L=3m supports a slightly inclined load P=2,5KN at the free end (see Figure Q2). 2.1 Plot a graph of the stress ?? at point A as a function of the angle of inclination ?. [16] 2.2 Plot a graph of the angle ?, which locates the neutral axis n-n, as a function of the angle ?. See Table F-2 of Appendix F for the dimensions and properties of the beam (When plotting the graphs, let ? vary from 0 ?? 10°).
A cantilever beam of IPN 300 section and length L=3m supports a slightly inclined load P=2,5KN at the free end (see Figure Q2). 2.1 Plot a graph of the stress ?? at point A as a function of the angle of inclination ?. [16] 2.2 Plot a graph of the angle ?, which locates the neutral axis n-n, as a function of the angle ?. See Table F-2 of Appendix F for the dimensions and properties of the beam (When plotting the graphs, let ? vary from 0 ?? 10°).

Steel Design (Activate Learning with these NEW titles from Engineering!)
6th Edition
ISBN:9781337094740
Author:Segui, William T.
Publisher:Segui, William T.
Chapter5: Beams
Section: Chapter Questions
Problem 5.5.16P

Related questions

Question
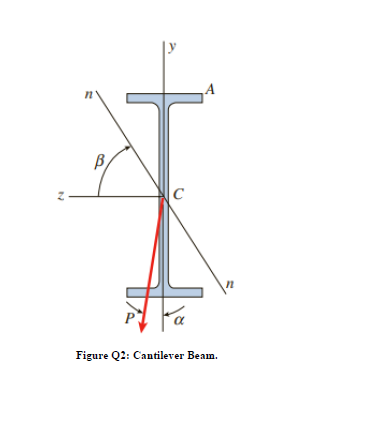
A cantilever beam of IPN 300 section and length L=3m supports a slightly inclined load P=2,5KN at the free end (see Figure Q2).
2.1 Plot a graph of the stress ?? at point A as a function of the angle of inclination ?. [16]
2.2 Plot a graph of the angle ?, which locates the neutral axis n-n, as a function of the angle ?. See Table F-2 of Appendix F for the dimensions and properties of the beam (When plotting the graphs, let ? vary from 0 ?? 10°).
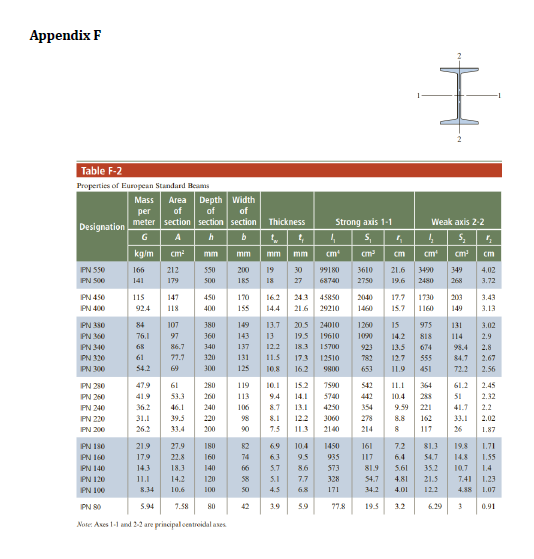
Transcribed Image Text:Appendix F
Table F-2
Properties of European Standard Beans
Designation
PN 550
PN 500
PN
PN 400
450
PN 380
PN 360
PN 340
PN 320
PN
300
PN 280
PN
260
PN 240
PN 220
PN 200
PN
180
PN 160
Mass Area Depth Width
per of of of
section section section
meter
G
A
h
kg/m
cm²
mm
166 212
550
141
179
500
115
924
84
76.1
68
61
54.2
47.9
41.9
36.2
31.1
26.2
21.9
17.9
14.3
11.1
147
118
107
97
86.7
77.7
69
61
53.3
450
400
280
260
46.1 240
39.5 220
33.4
200
27.9
22.8
380
360
340
320
300
180
160
140
120
100
PN 140
18.3
PN 120
14.2
PN 100
8.34
10.6
PN 80
5.94
7.58 80
Note: Axes 1-1 and 2-2 are principal centroidal ases
mm
200
185
170
155
149
143
98
90
82
74
66
Thickness
137
131 11.5
125
58
50
42
19 30
18
27
119 10.1
113
9.4
106
8.7
t
mm
13.7
13
12.2 18.3
16.2 24.3 45850 2040
14.4 21.6 29210 1460
Strong axis 1-1
S₁
ста
5.7
5.1
4
cm
20.5 24010 1260
1090
19.5 19610
15700
12510
17.3
10.8 16.2 9800
13.1
12.2
7.5 11.3
99180 3610
68740 2750
6.9 10.4
6.3
9.5
8.6
7,7
4.5 6.8
3.9
5.9
15.2
7590
14.1 5740
4250
3060
2140
1450
935
573
328
171
77.8
782
653
542
442
354
278
214
161
117
4₂
cm
21.6 3490 349
19.6
13.5
12.7
11.9
Weak axis 2-2
į S₂
cm¹
cm²³
17.7 1730 203
15.7 1160
149
2480
15 975
131
14.2 818 114
7.2
6.4
5.61
T
81.9
54.7 4.81
34.2 4.01
19.5 3.2
11.1
10.4
9.59 221
8.8 162
8
117
555
451
364
84.7
72.2
cm
4.02
3.72
21.5 7.41
12.2
6.29
3.43
3.13
61.2
2.45
51
2.32
41.7
2.2
33.1
2.02
26 1.87
3
3.02
2.9
2.8
2.67
2.56
81.3 19.8
1.71
14.8 1.55
54.7
35.2 10.7 1.4
1.23
1.07
0.91
Transcribed Image Text:N
n
B
C
A
Fa
Figure Q2: Cantilever Beam.
Expert Solution
This question has been solved!
Explore an expertly crafted, step-by-step solution for a thorough understanding of key concepts.

This is a popular solution!

Trending now
This is a popular solution!

Step by step
Solved in 5 steps with 2 images

Knowledge Booster


Learn more about
Need a deep-dive on the concept behind this application? Look no further. Learn more about this topic, civil-engineering and related others by exploring similar questions and additional content below.Recommended textbooks for you
Steel Design (Activate Learning with these NEW ti…
Civil Engineering
ISBN:
9781337094740
Author:
Segui, William T.
Publisher:
Cengage Learning
Steel Design (Activate Learning with these NEW ti…
Civil Engineering
ISBN:
9781337094740
Author:
Segui, William T.
Publisher:
Cengage Learning