A company that makes scarves has many different styles and colors that people can order. The company keeps track of the number of each style, color combination they make, and the average sale price for the scarves having that combination. They create a scatter plot using the data with the number of scarves along the x-axis and the average price per scarf, in dollars, along the y-axis. price per scarf in dollars 100 200 300 400 500 600 700 800 900 number of scarves made The data in the graph suggest a linear association. Which of the functions best represents the equation of the line of best fit?
A company that makes scarves has many different styles and colors that people can order. The company keeps track of the number of each style, color combination they make, and the average sale price for the scarves having that combination. They create a scatter plot using the data with the number of scarves along the x-axis and the average price per scarf, in dollars, along the y-axis. price per scarf in dollars 100 200 300 400 500 600 700 800 900 number of scarves made The data in the graph suggest a linear association. Which of the functions best represents the equation of the line of best fit?

Glencoe Algebra 1, Student Edition, 9780079039897, 0079039898, 2018
18th Edition
ISBN:9780079039897
Author:Carter
Publisher:Carter
Chapter4: Equations Of Linear Functions
Section4.5: Correlation And Causation
Problem 5PPS

Related questions
Question
Transcribed Image Text:5
average
that makes scarves has many different styles and colors that people can order. The company keeps track of the number of each style, color combination they make, and the
A company
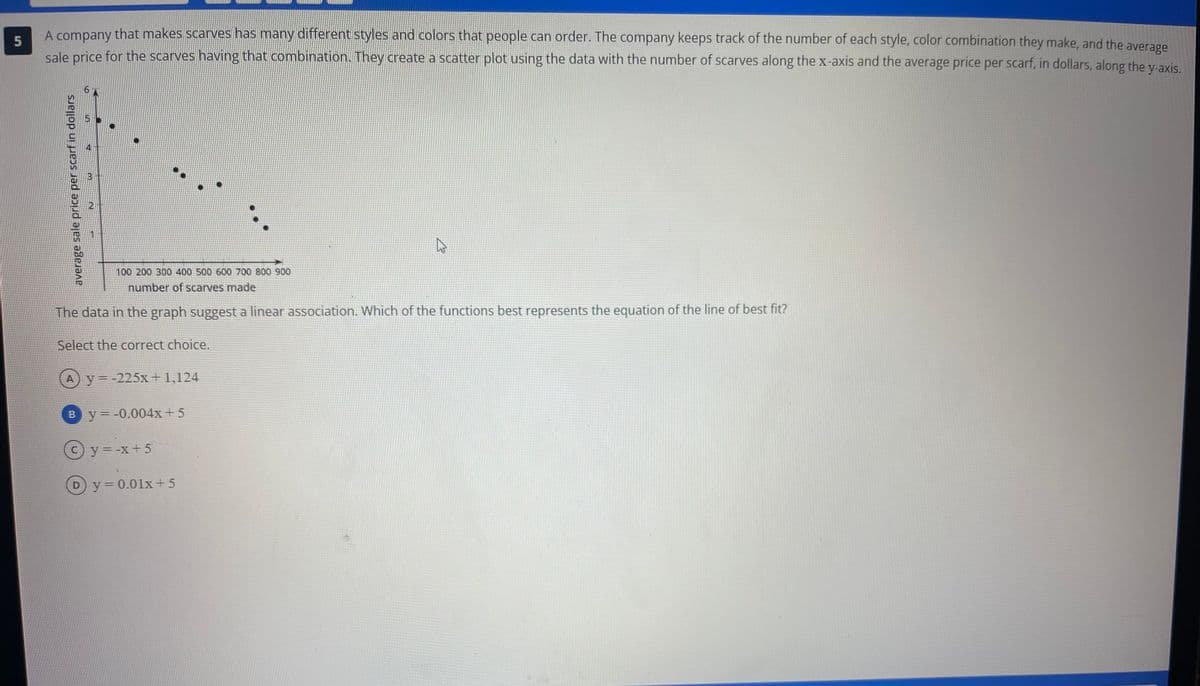
sale price for the scarves having that combination. They create a scatter plot using the data with the number of scarves along the x-axis and the average price per scarf, in dollars, along the y-axis.
average sale price per scarf in dollars
N
14
m
100 200 300 400 500 600 700 800 900
number of scarves made
The data in the graph suggest a linear association. Which of the functions best represents the equation of the line of best fit?
Select the correct choice.
A) y=-225x + 1,124
By = -0.004x + 5
c) y=-x+ 5
ے
y = 0.01x+5
Expert Solution
This question has been solved!
Explore an expertly crafted, step-by-step solution for a thorough understanding of key concepts.

This is a popular solution!

Trending now
This is a popular solution!

Step by step
Solved in 5 steps with 2 images

Recommended textbooks for you
Glencoe Algebra 1, Student Edition, 9780079039897…
Algebra
ISBN:
9780079039897
Author:
Carter
Publisher:
McGraw Hill

Holt Mcdougal Larson Pre-algebra: Student Edition…
Algebra
ISBN:
9780547587776
Author:
HOLT MCDOUGAL
Publisher:
HOLT MCDOUGAL

Glencoe Algebra 1, Student Edition, 9780079039897…
Algebra
ISBN:
9780079039897
Author:
Carter
Publisher:
McGraw Hill
Holt Mcdougal Larson Pre-algebra: Student Edition…
Algebra
ISBN:
9780547587776
Author:
HOLT MCDOUGAL
Publisher:
HOLT MCDOUGAL

Big Ideas Math A Bridge To Success Algebra 1: Stu…
Algebra
ISBN:
9781680331141
Author:
HOUGHTON MIFFLIN HARCOURT
Publisher:
Houghton Mifflin Harcourt