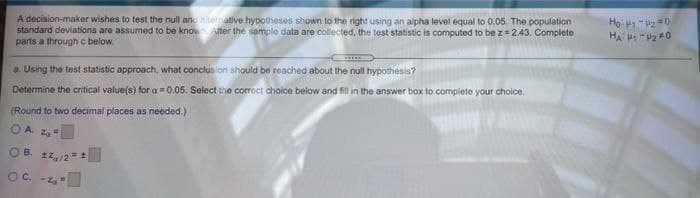
A decision-makor wishes to test the null andemative hypotheses shown to the right using an alpha level equal to 0.05. The population standard deviations are assumed to be known uter the sample data are collected, the test statistic is computed to be z=2.43. Complete parts a through c below Họ: H -2 =0 a. Using the test statistic approach, what conclus ion should be reached about the null hypothesis? Determine the critical value(s) for a= 0.05. Select the corroct choice below and fill in the answer box to complete your choice. (Round to two decimal places as needed.) O A. OB. 22/2=
Q: An insurance agent says the standard deviation of the total hospital charges for patients involved…
A: Consider that σ is the standard deviation for total hospital charges for patients involved in a…
Q: B- Perform each of the following steps. a. State the hypothesis and identify the claim b. Find the…
A: 1. The null and alternative hypothesis are given as : Ho : μ=200H1 : μ<200 The claim says, mean…
Q: The piston diameter of a certain hand pump is 0.7 inch. The manager determines that the diameters…
A:
Q: The American Milk Association is claiming that men drink more milk than women. If a sample of 45…
A: If a sample of 45 men drink on average 26 oz of milk a day with a standard deviation of 5oz. A…
Q: A box of cereal is labeled as weighing 16 ounces, but actually weighs closer to a mean of 16.3 and a…
A: We want to find (1) Q1 and Q3 (2) Outliers.
Q: A math teacher claims that she has developed a review course that increases the scores of students…
A: “Since you have posted a question with multiple sub-parts, we will solve the first three sub-parts…
Q: A fast food resultant estimates that the mean sodium content in one of its breakfast sandwiches is…
A: As per our guidelines we can solve first three subpart and rest can be reposted. Solution-: Given:…
Q: A random sample of 29 observations taken from a population that is normally distributed produced a…
A: Since you have asked multiple questions, we will solve the first question for you. If you want any…
Q: AARP claims the average annual expenditure for Americans age 50+ on restaurant food in 2008 was…
A: The given values are the sample size = n =32 the sample mean = X = 1945 The sample standard…
Q: Claim: The mean systolic blood pressure of all healthy adults is less than than 118 mm Hg. Sample…
A:
Q: A manufacturer of sports equipment has developed a new synthetic fishing line that he claims has a…
A: The random variable breaking strength follows normal distribution. We have to test whether the mean…
Q: A random sample of 88 eighth grade students' scores on a national mathematics assessment test has a…
A: Answer - Given Sample size n = 88, sample mean x = 281 and The population…
Q: A random sample of 8080 eighth grade students' scores on a national mathematics assessment test has…
A:
Q: Does the average Presbyterian donate more than the average Catholic in church on Sundays? The 48…
A: From the provided information,
Q: Human oral normal body temperature is believed to be 98.6° F, but there is evidence that it actually…
A: we have to complete hypothesis testing..
Q: The social worker for a particular town claims the average monthly cost for childcare outside the…
A:
Q: A used car delaer says that tge mean pruce of a tgree-year-old sporrs utility vehicle is $19,000.…
A: Givensample size(n)=23Mean(x)=19806standard deviation(s)=1986α=0.10
Q: A simple random sample from a population with a normal distribution of 98 body temperatures has x=…
A: Find critical values for chi-square distribution. Refer chi-square table to find the critical…
Q: The Toylot company makes an electric train with a motor that it claims will draw an average of only…
A:
Q: A company makes self-sealing stem bolts, which are supposed to average 2.00 cm in length. If the…
A: INTRODUCTION : Given : sample size = 100 therefore we use a large sample test for the population…
Q: Breyers is a major producer of ice cream and would like to test the hypothesis that the average…
A:
Q: A manufacturer claimed his mixer could mix more viscous materials than any other mixer. In a test of…
A: a. The null and alternative hypothesis are given by : Ho : μ=1700 poiseH1 : μ>1700 poise The…
Q: Mileage tests were conducted on a randomly selected sample of 100 newly developed automobile tires.…
A: It is given that, the sample size is 100, the sample mean is 50,000 and population standard…
Q: A soft-drink bottle vendor claims that its process yields bottles with a mean internal strength of…
A: Given,μ=157σ=3
Q: An appliance manufacturer claims to have developed a compact microwave oven that consumes an average…
A: (a) Determine the population of interest. The population of interest is determined below as…
Q: A state school administrator claims that the standard deviations of U.S. history assessment test…
A: a) Hypotheses: Null hypothesis: H0: s1=s2The standard deviations of U.S. history assessment test…
Q: An insurance agent says the standard deviation of the total hospital charges for patients involved…
A: From the provided information, The sample size (n) = 22 Sample standard deviation (s) = 4200
Q: A random sample of 19 observations taken from a population that is normally distributed produced a…
A: Given: a)Statistical hypothesis: Null hypothesis (H0): μ=46 Alternate hypothesis (H1): μ<46 It is…
Q: A network provider investigated t he number of blocked intrusions to its network, and found that…
A: Given that, Sample size n=35 Sample mean number of intrusions x¯=42 Sample standard deviation s=15.5…
Q: A manufacturing company developed a new type of hollow block that has a mean compressive strength of…
A: Given : Claim : u = 8
Q: Assume a significance level of a=0.05 and use the given information to complete parts (a) and (b)…
A: Given that: Original claim: The standard deviation of pulse rates of certain group of adult males is…
Q: An engineer has designed a valve that will regulate water pressure on an automobile engine. The…
A: The claim is that the valve performs below the specifications.
Q: A textile fiber manufacturer is investigating a new drapery yarn, which the company claims has a…
A: Solution: Given information: n= 4 Sample size μ=μo=18 Population mean σ= 2.4 Population standard…
Q: 4. Ishikawa et al. (Journal of Bioscience and Bioengineering, 2012) studied the adhesion of various…
A: Confidence Interval: In statistics, we can say a range of values of the specified population…
Q: A math teacher claims that she has developed a review course that increases the scores of students…
A: d) The sample mean is 526 and the standard deviation is 112.
Q: An engineer has designed a valve that will regulate water pressure on an automobile engine. The…
A: Given, Sample size = 220 Sample mean = 7.3 Population standard deviation = 0.9 Under the claim,…
Q: A random sample of 11 size AA batteries for toys yield a mean of 2.98 hours with standard deviation,…
A: GivenMean(x)=2.98standard deviation(s)=1.19sample size(n)=11
Q: A statistician claims that the average score on a standardized test of students who major is…
A: Given n=70 xbar=85 S=4
Q: The Department of Education would like to test the hypothesis that the average debt load of…
A:
Q: A fast food restaurant estimates that the mean sodium content in one of its breakfast sandwiches is…
A: Claim of the problem: The mean sodium content in one of its breakfast sandwiches is no more than 920…
Q: A researcher claims that the average wind speed in the desert is less than 18.3 kilometers per hour.…
A: We have given that Sample size n= 30 Sample mean = 17 Population standard deviation = 2.8
Q: A construction material manufacturer produces composite beams that are claimed to hold up to a…
A: Given n=100, Xbar=5900,s=800, alpha=0.05 We want to test the hypothesis
Q: Assume a significance level of a = 0.1 and use the given information to complete parts (a) and (b)…
A: Decision rule: If p-value ≤ α, then reject the null hypothesis. Otherwise, fail to reject the null…
Q: Does the average Presbyterian donate more than the average Catholic in church on Sundays? The 48…
A: Given: Sample 1 Sample mean x¯1=23Sample standard deviation s1=10Sample size (n1)=48 Sample 2…
Q: A random sample of 6 steam boiler pressure has a mean of 760 psi (pound per square inch) with its…
A:
Q: A random sample of 100 students showed that the average height is 168cm with a standard deviation of…
A:
Q: Medicare would like to test the hypothesis that the average monthly rate for one- bedroom…
A: Given n=sample size=12, sample mean x̄=3690, s=sample standard deviations=530, level of significance…
Q: It has long been stated that the mean lémper temperature of humans is less than 98 6°F They measured…
A: From the given data state the hypotheses
Step by step
Solved in 2 steps with 2 images
- Q1. An anthropologist wants to collect data to determine whether the two different cultural groups that occupy an isolated Pacific Island grow to be different heights. The results of his samples of the heights of adult females are as follows Do these samples constitute enough evidence to reject the null hypothesis that the heights of the two groups the same? Set alpha to 0.05 1.What are the appropriate null and alternative hypothesis? 2. What is the Test statistics? 3.What is the value of the test statistic? 4. For a significance level of 0.05, what is the critical value? 5.What is the appropriate decision and conclusion?The Toylot company makes an electric train with a motor that it claims will draw an average of only 0.8 ampere (A) under a normal load. A sample of nine motors was tested, and it was found that the mean current was x = 1.34 A, with a sample standard deviation of s = 0.41 A. Do the data indicate that the Toylot claim of 0.8 A is too low? (Use a 1% level of significance.) State the null and alternate hypotheses. H0: μ ≠ 0.8; H1: μ = 0.8H0: μ = 0.8; H1: μ ≠ 0.8 H0: p = 0.8; H1: p ≠ 0.8H0: p ≠ 0.8; H1: p = 0.8H0: p = 0.8; H1: p > 0.8H0: μ = 0.8; H1: μ > 0.8 What sampling distribution will you use? What assumptions are you making? The Student's t, since we assume that x has a normal distribution with known σ.The standard normal, since we assume that x has a normal distribution with unknown σ. The standard normal, since we assume that x has a normal distribution with known σ.The Student's t, since we assume that x has a normal distribution with unknown σ. What is the value of the…A researcher wishes to test the claim that the average cost of tuition and fees at a four-year public college is greater than $5700. She selects a random sample of 36 four-year public colleges and finds the mean to be $5950. The population standard deviation is $659. Is there evidence to support the claim at 0.05? STEP 1. State the null and alternate hypothesis. CHOOSE THE LETTER THAT CORRESPONDS TO THE CORRECT ANSWER. STEP 2. The critical value (s) is/are: z1 = z2 = (IF THERE IS ONLY ONE CRITICAL VALUE ENTER IT IN THE LEFT BOX AND ENTER N/A IN THE RIGHT BOX.) STEP 3. The test-value z0 is: z0 = (Round to two decimal places.)
- A group says that the mean daily lodging cost for a family traveling in Region 1 is the same as in Region 2. The mean daily lodging cost for 41 families traveling in Region 1 is $130 with a population standard deviation of $26. The mean daily lodging cost for 41 families traveling in Region 2 is $138 with a population standard deviation of $25. At α=0.10, is there enough evidence to reject the group's claim? Complete parts (a) through (e). (a) Identify the claim and state Upper H 0H0 and Upper H Subscript aHa. What is the claim? A. The mean daily lodging cost in Region 1 is less than Region 2. Your answer is not correct. B. The mean daily lodging cost in Region 1 is greater than Region 2. C. The mean daily lodging costs in Region 1 and Region 2 are different. D. The mean daily lodging costs in Region 1 and Region 2 are equal. This is the correct answer. What are Upper H 0H0 and Upper H Subscript aHa? A. Upper H 0H0: mu 1μ1greater…J 1 Consider the hypothesis statement to the right using a=0.01 and the data to the right from two independent samples. A) calcuate the appropriate test statistic and interpret the results b) calculate the p value and interpret the resultsA nutritionist claims that the mean tuna consumption by a person is 3.6 pounds per year. A sample of 70 people shows that the mean tuna consumption by a person is 3.4 pounds per year. Assume the population standard deviation is 1.19 pounds. At alphaαequals=0.05, can you reject the claim? (a) Identify the null hypothesis and alternative hypothesis. A. Upper H 0H0: muμless than or equals≤3.6 Upper H Subscript aHa: muμgreater than>3.6 B. Upper H 0H0: muμgreater than>3.6 Upper H Subscript aHa: muμless than or equals≤3.6 C. Upper H 0H0: muμnot equals≠3.4 Upper H Subscript aHa: muμequals=3.4 D. Upper H 0H0: muμgreater than>3.4 Upper H Subscript aHa: muμless than or equals≤3.4 E. Upper H 0H0: muμequals=3.6 Upper H Subscript aHa: muμnot equals≠3.6 F. Upper H 0H0: muμless than or equals≤3.4 Upper H Subscript aHa: muμgreater than>3.4 (b) Identify the standardized test statistic.…
- A manufacturer of chocolate chips would like to know whether its bag filling machine works correctly at the 432 gram setting. It is believed that the machine is underfilling or overfilling the bags. A 44 bag sample had a mean of 428 grams. Assume the population standard deviation is known to be 26. Is there sufficient evidence at the 0.05 level that the bags are underfilled or overfilled? Step 1 of 7: State the null and alternative hypotheses Step 2 of 7: Find the value of the test statistic. Round your answer to two decimal places. Step 3 of 7: Specify if the test is one-tailed or two-tailed. Step 4 of 7: Determine the P-value of the test statistic. Round your answer to four decimal places. Step 5 of 7: Identify the value of the level of significance. Step 6 of 7: Make the decision to reject or fail to reject the null hypothesis.The nicotine content in cigarettes of a certain brand is normally distributed. The brand advertises that the mean nicotine content of their cigarettes is µ = 1.5, but measurements on a random sample of 100 cigarettes of this brand gave a mean of ?̅= 1.53 and s = 0.95. Is this evidence that the mean nicotine content is actually higher than advertised? 1. State the appropriate null and alternative hypotheses. H0: ? = 1.5 Ha: ? > 1.5 2. Should you use the z or t test? t – do not have sigma 3. Compute the test statistic to test your hypotheses. (report to 2 decimal places) ? = 1.53−1.5 0.95 √100 ⁄ = 0.32 4. Find the appropriate range of p-value for your test. P-value: a. Less than 0.005 b. Between 0.005 and 0.01 c. Between 0.01 and 0.025 d. Between 0.025 and 0.05 e. Greater than 0.05As a bonus assignment a former student checked if your professor gave a statistically significant difference in grades between his male and female students. She based her study based on grades assigned in intermediate Econ courses (Econ 303, 305 and 317) and her sample included nm = 485 male students and nf = 264 female students. The average grades received were ?̅ = 84.6 and ?̅ = 85.8. The population standard ?? deviation were σ m = 12.0 and σ f = 11.4. Test the hypothesis that the two groups received different grades using a 95% confidence level and using the critical value approach