(a) Explain how the Nyquist stability criterion can be used to determine the
(a) Explain how the Nyquist stability criterion can be used to determine the

Power System Analysis and Design (MindTap Course List)
6th Edition
ISBN:9781305632134
Author:J. Duncan Glover, Thomas Overbye, Mulukutla S. Sarma
Publisher:J. Duncan Glover, Thomas Overbye, Mulukutla S. Sarma
Chapter12: Power System Controls
Section: Chapter Questions
Problem 12.3P

Related questions
Question
Transcribed Image Text:Explain how the Nyquist stability criterion can be used to determine the
stability of a closed-loop feedback system. Formulate the criterion for a
system with no right-half plane open-loop poles.
(a)
(b)
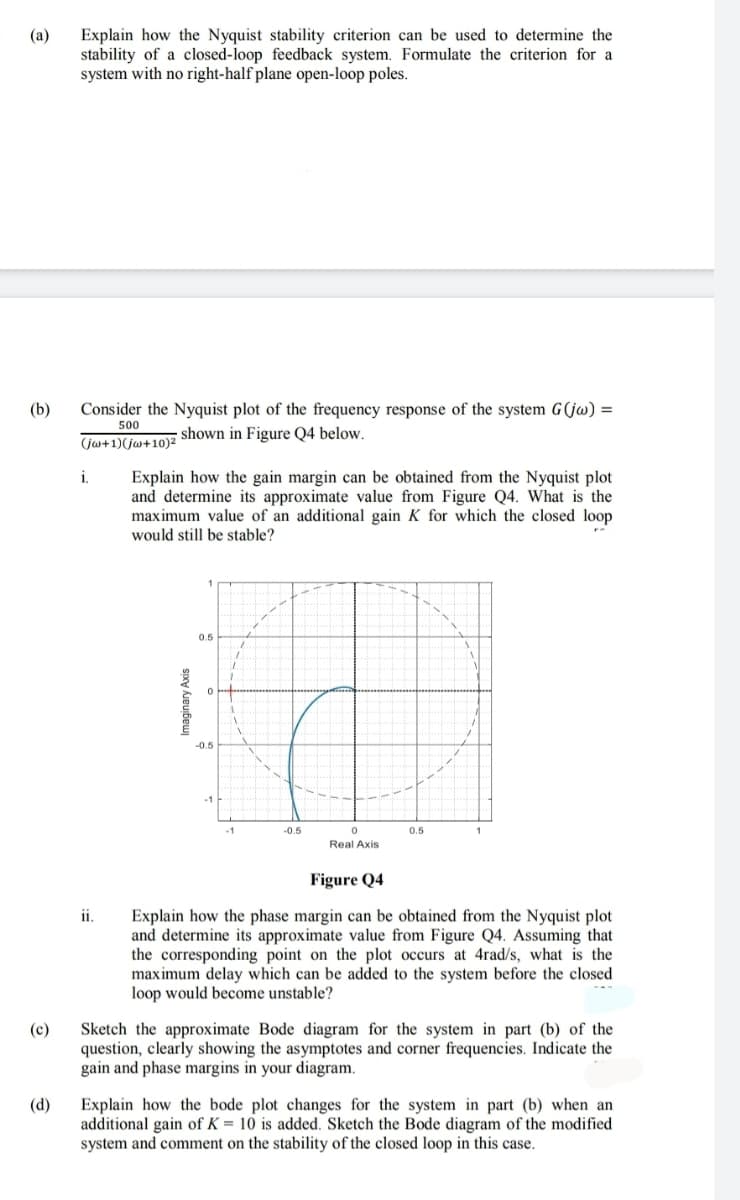
Consider the Nyquist plot of the frequency response of the system G(jw) =
500
shown in Figure Q4 below.
(jw+1)(jw+10)²
i.
Explain how the gain margin can be obtained from the Nyquist plot
and determine its approximate value from Figure Q4. What is the
maximum value of an additional gain K for which the closed loop
would still be stable?
0.5
-0.5
-0.5
0.5
Real Axis
Figure Q4
i.
Explain how the phase margin can be obtained from the Nyquist plot
and determine its approximate value from Figure Q4. Assuming that
the corresponding point on the plot occurs at 4rad/s, what is the
maximum delay which can be added to the system before the closed
loop would become unstable?
Sketch the approximate Bode diagram for the system in part (b) of the
question, clearly showing the asymptotes and corner frequencies. Indicate the
gain and phase margins in your diagram.
(c)
(d)
Explain how the bode plot changes for the system in part (b) when an
additional gain of K = 10 is added. Sketch the Bode diagram of the modified
system and comment on the stability of the closed loop in this case.
Imaginary Axis
Expert Solution
This question has been solved!
Explore an expertly crafted, step-by-step solution for a thorough understanding of key concepts.

Step by step
Solved in 2 steps

Knowledge Booster


Learn more about
Need a deep-dive on the concept behind this application? Look no further. Learn more about this topic, electrical-engineering and related others by exploring similar questions and additional content below.Recommended textbooks for you
Power System Analysis and Design (MindTap Course …
Electrical Engineering
ISBN:
9781305632134
Author:
J. Duncan Glover, Thomas Overbye, Mulukutla S. Sarma
Publisher:
Cengage Learning
Power System Analysis and Design (MindTap Course …
Electrical Engineering
ISBN:
9781305632134
Author:
J. Duncan Glover, Thomas Overbye, Mulukutla S. Sarma
Publisher:
Cengage Learning