A graph of the function g(x) = sin (x) is shown. Use the graphing utility to sketch the graph of the function h(x) = sin (–x) on the same coordinate axes. Reset у 4 2 -3n/2 -T/2 T/2 3n/2 -2 -3 +
A graph of the function g(x) = sin (x) is shown. Use the graphing utility to sketch the graph of the function h(x) = sin (–x) on the same coordinate axes. Reset у 4 2 -3n/2 -T/2 T/2 3n/2 -2 -3 +

Functions and Change: A Modeling Approach to College Algebra (MindTap Course List)
6th Edition
ISBN:9781337111348
Author:Bruce Crauder, Benny Evans, Alan Noell
Publisher:Bruce Crauder, Benny Evans, Alan Noell
Chapter2: Graphical And Tabular Analysis
Section2.1: Tables And Trends
Problem 1TU: If a coffee filter is dropped, its velocity after t seconds is given by v(t)=4(10.0003t) feet per...

Related questions
Question
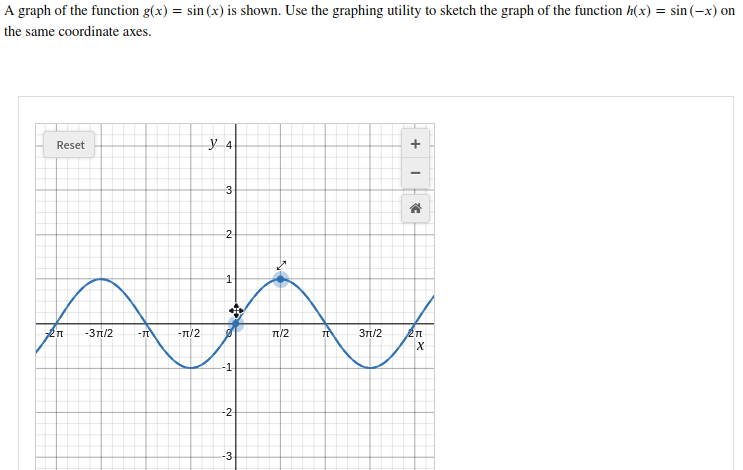
Transcribed Image Text:A graph of the function g(x) = sin (x) is shown. Use the graphing utility to sketch the graph of the function h(x) = sin (-x) on
the same coordinate axes.
Reset
y 4
3.
-31/2
-n/2
π/2
Зп/2
-1
-2-
-3
2.
Expert Solution
This question has been solved!
Explore an expertly crafted, step-by-step solution for a thorough understanding of key concepts.

Step by step
Solved in 2 steps with 1 images

Recommended textbooks for you
Functions and Change: A Modeling Approach to Coll…
Algebra
ISBN:
9781337111348
Author:
Bruce Crauder, Benny Evans, Alan Noell
Publisher:
Cengage Learning

College Algebra
Algebra
ISBN:
9781305115545
Author:
James Stewart, Lothar Redlin, Saleem Watson
Publisher:
Cengage Learning
Functions and Change: A Modeling Approach to Coll…
Algebra
ISBN:
9781337111348
Author:
Bruce Crauder, Benny Evans, Alan Noell
Publisher:
Cengage Learning
College Algebra
Algebra
ISBN:
9781305115545
Author:
James Stewart, Lothar Redlin, Saleem Watson
Publisher:
Cengage Learning