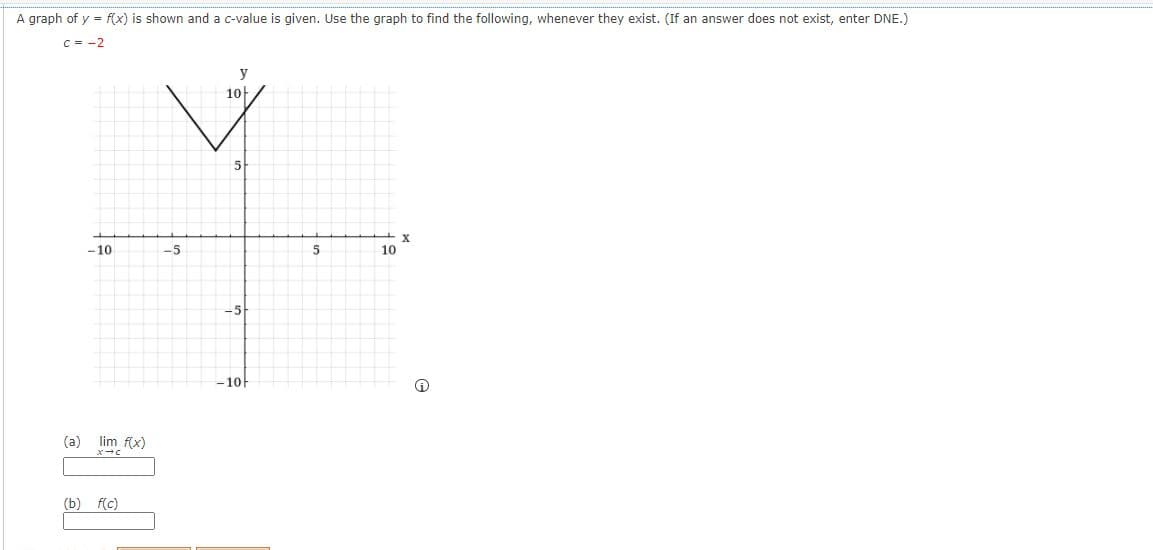
A graph of y = f(x) is shown and a c-value is given. Use the graph to find the following, whenever they exist. (If an answer does not exist, enter DNE.) C = -2 y 10 -10 -5 5 10 -5 -10


Q: Given the graph of f" (x) at what values is there a possible inflection point? y 2 4 8 O 1, 4, and 7…
A: We have to check
Q: Given the graph of y = f(r) below, at which of the marked r-values can the following statements be…
A:
Q: 6. Determine the domain and range, respectively, of the graph at the right. a. D-/xE and R-/y e9) b.…
A:
Q: The graph of h (x)is shown. b a e h At what point(s), if any, is h' (x) < 0 and h " (x) < 0
A: Consider the graph of h(x)
Q: The graph of f(x) is shown. At which of the point(s) is f '(x) 0? E A D B C
A:
Q: In the given question , match the function with its graph. [The graphs are labeled (a), (b), (c),…
A: Given, fx=ln x+1
Q: Graph g(x) and –g() -9() from g(x)? on the same axes for the x-interval x E [0, 5]. How did you get
A: we have to get the graph -g((5-x)/2) from g(x)
Q: y -1 1 2 4 3,
A:
Q: 1. Find all values of x where a) f(x) = 0, b) f(x) > 0, and c) f(x) 0 when c)f (x) <0 when
A:
Q: "Given the graph of y f(1) below, answer all of the following questions.
A:
Q: 3. the locator point (h, k)? Sketch a graph of each function b. y =-x+1|+ 3
A: To obtain the points on the graph, substitute arbitrary values for x in the equation y=-x+1+3 and…
Q: The graph of y=f(x) is shown in the following diagram. a) What is the value of i) f(2)? ii)…
A:
Q: Use the given graph of y = f(x) to solve for what value(s) of x is f(x) = 1?
A:
Q: A graph of y = f (x) is shown below. -1 P. Based on this graph, at which labeled point does f (x)…
A:
Q: The graph of y = h(x) is shown at below. Give a piecewise formula for h. -5- 4 2 -2 -1 0 1 2 3 -1 4.…
A: Given the graph of y=hx is
Q: Use the graph of y = f(x) to sketch the graph of f'(x). 3+ 27 -37/2 -T/2 Зл/2 27 -1+ -2- -3- Clear…
A: The graph of derivative of the function is given by taking tangent of angle made by curve with…
Q: The graph of y = f(x) is shown in red. Graph y = f(x) + 3. O A. OB. Choose the correct graph (in…
A:
Q: f (x) = |x – 1|
A: Given: - The function is, f(x)=x-1 To determine - Graph y = f(x) by hand by first plotting points to…
Q: the graph of y=f(x) below answer all of the following questions:
A:
Q: Given the graph of y = f(x), shown as a red dashed curve, drag the movable blue point to obtain the…
A: THE EXPLANATION HAS BEEN GIVEN IN THE ATTACHED FILE BELOW .
Q: Use the graph y=e^x to evaluate e^1.7 to four decimal
A:
Q: Dvaw the graph for the function y- Find (Pp) & (RE) and then %3D X-2
A: To draw the graph of the function, we need to simplify the function as below:…
Q: The graph of y = h(x) is given below. Which one of the following represents the equation for h(x)?…
A: Given the graph of h(x). We need to find equation which represent to h(x).
Q: Given the graph of y = f(x) below, answer all of the following questions. %3D 10 -18 -5 18 18 (a)…
A: A function is a relation which maps each value in its domain to exactly one value in its range.…
Q: Use the graph of y = f(x) in the given figure to obtain each of the following graphs: a. g(x) =…
A: h(x) = f(1/2x)
Q: The graph of the relation T is shown below. y. 2. 4 Give the domain and range of T.
A: From the given graph, the ordered pairs are -4,4,-2,0,-1,-1 and 1,-2. Here the domain is all the…
Q: The graph of y = f(x) is given below. Evaluate | f(x)dx 6+ 3- -1 -2 -3 -4 y = f(x) -6+
A: Application of integration
Q: 4. Given the graph of y f(x) at right, draw a graph of each of these related functions. ソ=k) a. y=…
A: Transformation of graph: Let us suppose y=f(x) be the graph then 1) the graph of y=f(-x) means…
Q: Given the graph of y = f(x) and g(x) = S f (x) da %3D 4 2 -4 -2 Evaluate g(1) = %3D
A: Given the graph of the function f(x) and g(x) as the integral of f(x) from 3 to x. So, g(1) is the…
Q: A graph of y = f(x) is shown and a c-value is given. Use the graph to find the following, whenever…
A:
Q: 11. Choose the best answer. To _the graph of f(±) = a+clog,(dz+g), change the parameter c.
A:
Q: Use the graph of y = f(x) to sketch the graph of f '(x). 3. 2- -37/2 /2 T/2 37/2 27 -1- -3. Draw: M…
A: Given data :
Q: The graph of y=/(x) is given. Graph y=-f(x) + 1.
A: Graph is given of the function y=f(x). We need to graph y=-f(x)+1
Q: 1. For the function y=e* , draw the graph for 0<x<2, taking intervals of 0.5 and state the…
A:
Q: (a) Given the curve of y=x(x+3)(x − 2)(x-5) 10 i) Sketch the graph for -4<x<6 6 +1
A:
Q: Write an equation of the form f(x) = a* +b from the given graph. Then compute f(2). Ay f(x) (1,5.3)…
A: Given that we need to write the equation of given graph in the form f(x) = ax + b Now, Since…
Q: Given the graph of y = f(x) in the figure above, graph g(x) = f(x − 3) − 1.
A: To determine the graph of the function g(x).
Q: Suppose g(x) = VF(x), where the graph of f (the blue curve) is shown bele Then g' (2)= 6.5
A: Given query is to find the value of g'(2).
Q: (a) To obtain the graph of g(x) = 2* – 1, we start with the graph of f(x) = 2* and shift it %3D…
A: The graphs of y = 2^x - 1 and y = 2^x are given as follows: The red colored graph represents the…
Q: Use the graph of y = f(x) shown below to graph the function q. Choose the correct graph below. g(x)…
A:
Q: ketch the graph of T3.
A: Given the problem deal with the following function f(x)=2xif 0≤x≤122-2xif…
Q: 3. Given the graph of f(x), sketch the graph of y = S(x)* a) b) 2- -8-7 -6-5-43-2-1 123 5678 -2 -4…
A: (a) Here is the given graph, It is the graph of a quadratic function,
Q: A graph of y = f(x) is shown and a c-value is given. Use the graph to find the following, whenever…
A:
Q: (a) Sketch the graph of the given function. { 5, 0<t< 2 f(t) 5e-(t-2), t22
A: Let us solve the graph first..then we can find f(t) value
Q: If f(x) = ax4 + bx³ + cx2 + dx + e, determine a, b, c, d and e so that the graph of f will have a…
A:
Q: Given the graph of y = f(x), as shown: 1. What is the domain of f(x)? 2. What is the range of…
A: Given,
Q: Given the graph of y = f(x) shown below, what is the graph of y = f(x+1) – 4? 5 3 2 -7–6–5-4-3-21 2…
A:
Q: The graph of y = f(x) is shown below. Which point could be used to find f(0)? %3D 10 6. 8. 3 D -10-9…
A: Given: The graph of y = f(x) To find f(0) = ?
Q: Given the graph of y = f(x), shown as a red dashed curve, drag the movable blue point to obtain the…
A:


Trending now
This is a popular solution!

Step by step
Solved in 2 steps with 2 images

- Below is a graph of the function g(x). Use this graph to complete the problems given below. a) lim x->2 g(x) =? b) lim x->0 g(x) =? c) lim x->4- g(x) =? d) lim x->4+ g(x) =? Based on the answrs in c and d does lim x->4 g(x) exist?1. Evaluate lim (2x-5) given its graph below. x →2 a.0 b. -1 c. 2 d. 1 2. Given the graph of f(x) below, evaluate its limit as x approaches 3. a.2 b. 3 c. 1 d. 0Use the graph of the function h(x) given below to answer the questions that follow. (1) Evaluate h(−2) (a) Find lim x → −2- h(x) (b) Find lim x → -2+ h(x) (c) Use your answers from parts (b) and (c) to find lim x→-2 h(x).
- True or False? b). If lim x -> 5f(x) = DNE, then f (5) =DNE.If the statement is TRUE, explain why. If the statement is FALSE, sketch the graph of a counterexample.Sketch a graph of a function satisfying the following properties. 1) lim f(x)= -2 x--> 5 2) f'(5)=DNE(a) What is wrong with the following equation? x2 + x − 12 x − 3 = x + 4 (x − 3)(x + 4) ≠ x2 + x − 12 The left-hand side is not defined for x = 0, but the right-hand side is. The left-hand side is not defined for x = 3, but the right-hand side is.None of these — the equation is correct. (b) In view of part (a), explain why the equation lim x → 3 x2 + x − 12 x − 3 = lim x → 3 (x + 4) is correct. Since x2 + x − 12 x − 3 and x + 4 are both continuous, the equation follows. Since the equation holds for all x ≠ 3, it follows that both sides of the equation approach the same limit as x → 3. This equation follows from the fact that the equation in part (a) is correct.None of these — the equation is not correct.
- Let G(x) = (x + 6)/(x2 + 4x - 12). a. Make a table of the values of G at x = -5.9, -5.99, -5.999, and so on. Then estimate limx--> -6 G(x). What estimate do you arrive at if you evaluate G at x = -6.1, -6.01, -6.001, .....instead? b. Support your conclusions in part (a) by graphing G and using Zoom and Trace to estimate y-values on the graph as x --> -6Use the graph of the function h(x) given below to answer the questions that follow. (1) Evaluate h(2). 2 DNE 4 (a) Find lim x → 2- h(x) (b) Find lim x → 2+ h(x) (c) Use your answers from parts (b) and (c) to find lim x → 2 h(x)f'(x) = (x-1)(x-2)(x-3)(x-4) What can be said about lim(x->infinity) if anything?
- let g(x) = x2 + x − 12 / |x − 3| (a) Find the following limits. (If an answer does not exist, enter DNE.) (i) lim x → 3+ g(x) (ii) lim x → 3− g(x) (b) sketch the grapha)Find the domain of the function f and graph the domain of f. b) Show that lim (x,y) —>(0,1) f (x, y) cannot be found.1.What is the value of lim f(x) ? 2.What is the value of f(c)? 3.What would be the value of f(c) so that the function will be continuous at x=-3? 4.Does f(c) exist?