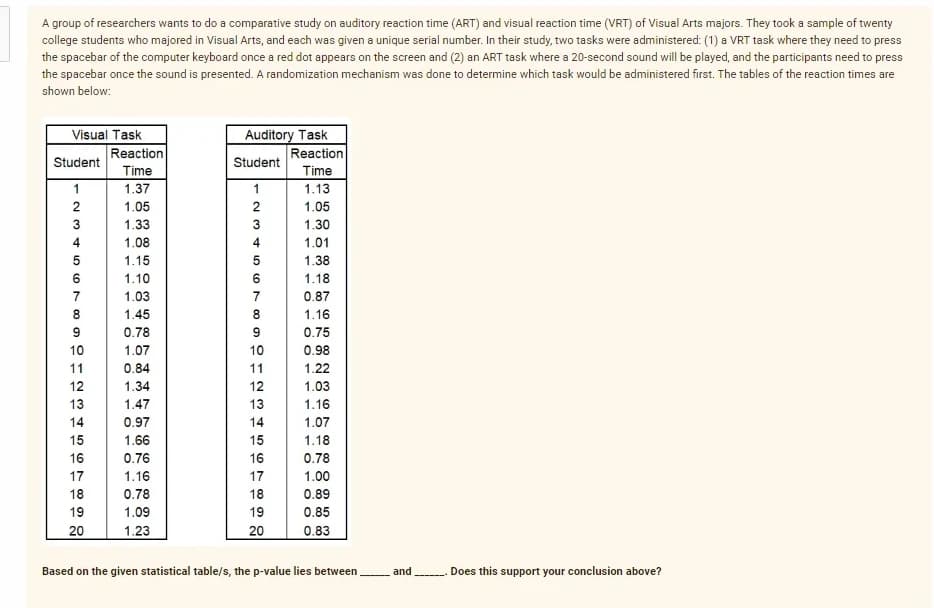
A group of researchers wants to do a comparative study on auditory reaction time (ART) and visual reaction time (VRT) of Visual Arts majors. They took a sample of twenty college students who majored in Visual Arts, and each was given a unique serial number. In their study, two tasks were administered: (1) a VRT task where they need to press the spacebar of the computer keyboard once a red dot appears on the screen and (2) an ART task where a 20-second sound will be played, and the participants need to press the spacebar once the sound is presented. A randomization mechanism was done to determine which task would be administered first. The tables of the reaction times are shown below:
A group of researchers wants to do a comparative study on auditory reaction time (ART) and visual reaction time (VRT) of Visual Arts majors. They took a sample of twenty college students who majored in Visual Arts, and each was given a unique serial number. In their study, two tasks were administered: (1) a VRT task where they need to press the spacebar of the computer keyboard once a red dot appears on the screen and (2) an ART task where a 20-second sound will be played, and the participants need to press the spacebar once the sound is presented. A randomization mechanism was done to determine which task would be administered first. The tables of the reaction times are shown below:

Glencoe Algebra 1, Student Edition, 9780079039897, 0079039898, 2018
18th Edition
ISBN:9780079039897
Author:Carter
Publisher:Carter
Chapter10: Statistics
Section: Chapter Questions
Problem 22SGR

Related questions
Question
Transcribed Image Text:A group of researchers wants to do a comparative study on auditory reaction time (ART) and visual reaction time (VRT) of Visual Arts majors. They took a sample of twenty
college students who majored in Visual Arts, and each was given a unique serial number. In their study, two tasks were administered: (1) a VRT task where they need to press
the spacebar of the computer keyboard once a red dot appears on the screen and (2) an ART task where a 20-second sound will be played, and the participants need to press
the spacebar once the sound is presented. A randomization mechanism was done to determine which task would be administered first. The tables of the reaction times are
shown below:
Visual Task
Auditory Task
Reaction
Reaction
Student
Student
Time
Time
1.37
1
1.13
1.05
2
1.05
3
1.33
3
1.30
4
1.08
4
1.01
1.15
1.38
1.10
6
1.18
7
1.03
7
0.87
8
1.45
1.16
0.78
0.75
10
1.07
10
0.98
11
0.84
11
1.22
12
1.34
12
1.03
13
1.47
1.16
14
0.97
14
1.07
15
1.66
15
1.18
16
0.76
16
0.78
17
1.16
17
1.00
18
0.78
18
0.89
19
1.09
19
0.85
20
1.23
20
0.83
Based on the given statistical table/s, the p-value lies between
and
Does this support your conclusion above?
3 4 5 O
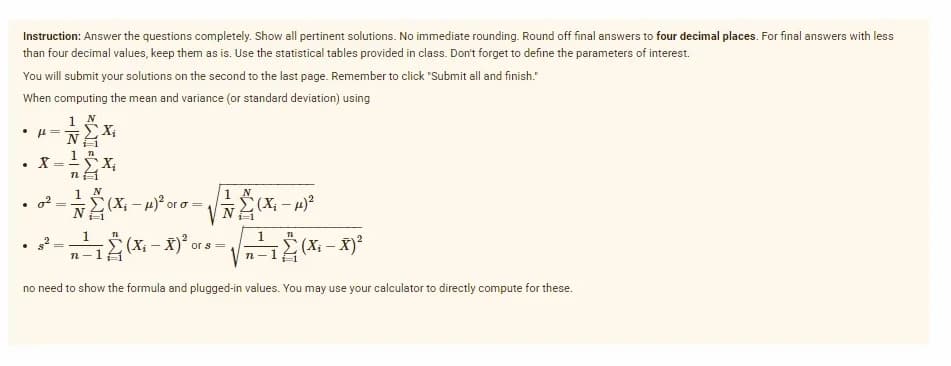
Transcribed Image Text:Instruction: Answer the questions completely. Show all pertinent solutions. No immediate rounding. Round off final answers to four decimal places. For final answers with less
than four decimal values, keep them as is. Use the statistical tables provided in class. Don't forget to define the parameters of interest.
You will submit your solutions on the second to the last page. Remember to click "Submit all and finish."
When computing the mean and variance (or standard deviation) using
X;
X = X;
1
1 N
1 N
(X; – 4)?
or o=
1
1
(X; – X)²
or s=
n-1 (X; – X)²
no need to show the formula and plugged-in values. You may use your calculator to directly compute for these.
of
Expert Solution
This question has been solved!
Explore an expertly crafted, step-by-step solution for a thorough understanding of key concepts.

Step by step
Solved in 3 steps with 3 images

Recommended textbooks for you
Glencoe Algebra 1, Student Edition, 9780079039897…
Algebra
ISBN:
9780079039897
Author:
Carter
Publisher:
McGraw Hill

Big Ideas Math A Bridge To Success Algebra 1: Stu…
Algebra
ISBN:
9781680331141
Author:
HOUGHTON MIFFLIN HARCOURT
Publisher:
Houghton Mifflin Harcourt
Glencoe Algebra 1, Student Edition, 9780079039897…
Algebra
ISBN:
9780079039897
Author:
Carter
Publisher:
McGraw Hill
Big Ideas Math A Bridge To Success Algebra 1: Stu…
Algebra
ISBN:
9781680331141
Author:
HOUGHTON MIFFLIN HARCOURT
Publisher:
Houghton Mifflin Harcourt