(a) If a single infectious individual enters the city at t = 0, compute the progression of the epidemic until the number of infected individuals falls below 10. Use the following parameters: a = 0.002/(person-week) and r = %3D 0.15/d. Develop time-series plots of all the state variables. Also generate a phaseplane plot of S versus / versus R.
(a) If a single infectious individual enters the city at t = 0, compute the progression of the epidemic until the number of infected individuals falls below 10. Use the following parameters: a = 0.002/(person-week) and r = %3D 0.15/d. Develop time-series plots of all the state variables. Also generate a phaseplane plot of S versus / versus R.

Algebra & Trigonometry with Analytic Geometry
13th Edition
ISBN:9781133382119
Author:Swokowski
Publisher:Swokowski
Chapter5: Inverse, Exponential, And Logarithmic Functions
Section5.6: Exponential And Logarithmic Equations
Problem 64E

Related questions
Question
Please answer the point a
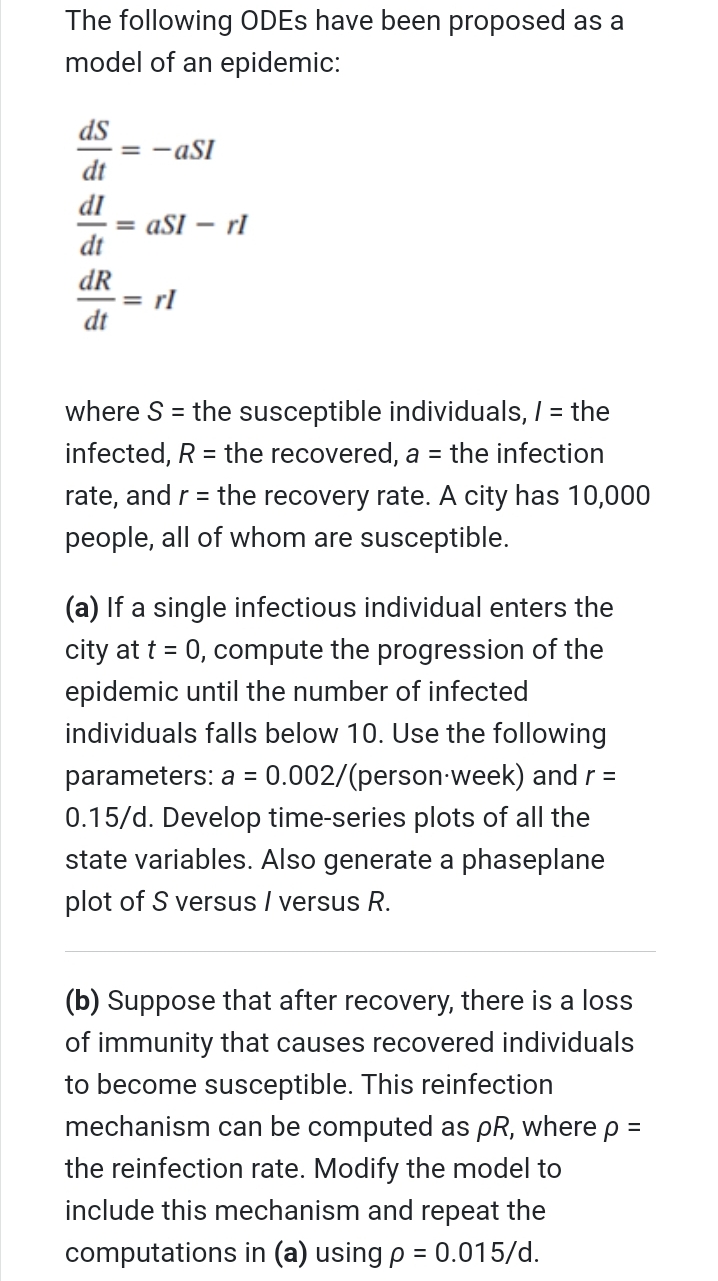
Transcribed Image Text:The following ODES have been proposed as a
model of an epidemic:
ds
= -aSI
dt
dI
= aSI
dt
- rl
dR
= rl
dt
where S = the susceptible individuals, / = the
infected, R = the recovered, a = the infection
rate, and r = the recovery rate. A city has 10,000
%3D
people, all of whom are susceptible.
(a) If a single infectious individual enters the
city at t = 0, compute the progression of the
epidemic until the number of infected
individuals falls below 10. Use the following
parameters: a = 0.002/(person-week) and r =
%3D
0.15/d. Develop time-series plots of all the
state variables. Also generate a phaseplane
plot of S versus / versus R.
(b) Suppose that after recovery, there is a loss
of immunity that causes recovered individuals
to become susceptible. This reinfection
mechanism can be computed as pR, where p =
the reinfection rate. Modify the model to
include this mechanism and repeat the
computations in (a) using p = 0.015/d.
Expert Solution
This question has been solved!
Explore an expertly crafted, step-by-step solution for a thorough understanding of key concepts.

This is a popular solution!

Trending now
This is a popular solution!

Step by step
Solved in 2 steps with 2 images

Recommended textbooks for you
Algebra & Trigonometry with Analytic Geometry
Algebra
ISBN:
9781133382119
Author:
Swokowski
Publisher:
Cengage

Trigonometry (MindTap Course List)
Trigonometry
ISBN:
9781337278461
Author:
Ron Larson
Publisher:
Cengage Learning
Algebra & Trigonometry with Analytic Geometry
Algebra
ISBN:
9781133382119
Author:
Swokowski
Publisher:
Cengage
Trigonometry (MindTap Course List)
Trigonometry
ISBN:
9781337278461
Author:
Ron Larson
Publisher:
Cengage Learning