A- If the density function is shown below, what is the probabilities that when X exceed % and when X be less than or cqual to %? [2(1-r), 0er
A- If the density function is shown below, what is the probabilities that when X exceed % and when X be less than or cqual to %? [2(1-r), 0er

Chapter6: Exponential And Logarithmic Functions
Section6.8: Fitting Exponential Models To Data
Problem 56SE: Recall that the general form of a logistic equation for a population is given by P(t)=c1+aebt , such...

Related questions

Concept explainers
Contingency Table
A contingency table can be defined as the visual representation of the relationship between two or more categorical variables that can be evaluated and registered. It is a categorical version of the scatterplot, which is used to investigate the linear relationship between two variables. A contingency table is indeed a type of frequency distribution table that displays two variables at the same time.
Binomial Distribution
Binomial is an algebraic expression of the sum or the difference of two terms. Before knowing about binomial distribution, we must know about the binomial theorem.
Topic Video
Question
I need the answer quickly
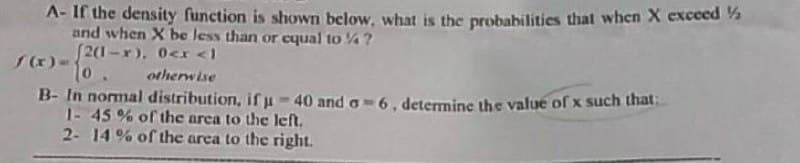
Transcribed Image Text:A- If the density function is shown below, what is the probabilities that when X excecd %
and when X be less than or cqual to %?
(x)-21-r), 0cr <
otherwise
10
B- In normal distribution, if -40 and a 6. determine the value of x such that:
1-45% of the area to the left.
2- 14% of the area to the right.
Expert Solution
This question has been solved!
Explore an expertly crafted, step-by-step solution for a thorough understanding of key concepts.

Step by step
Solved in 4 steps with 4 images

Knowledge Booster


Learn more about
Need a deep-dive on the concept behind this application? Look no further. Learn more about this topic, probability and related others by exploring similar questions and additional content below.Recommended textbooks for you

Functions and Change: A Modeling Approach to Coll…
Algebra
ISBN:
9781337111348
Author:
Bruce Crauder, Benny Evans, Alan Noell
Publisher:
Cengage Learning
Functions and Change: A Modeling Approach to Coll…
Algebra
ISBN:
9781337111348
Author:
Bruce Crauder, Benny Evans, Alan Noell
Publisher:
Cengage Learning