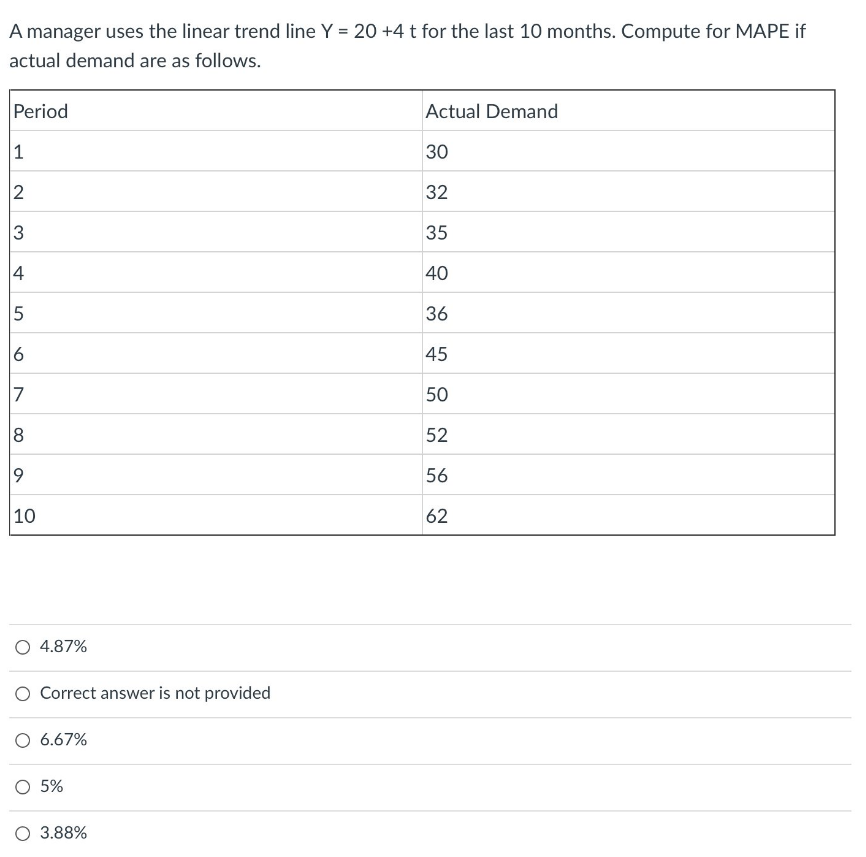
A manager uses the linear trend line Y = 20 +4 t for the last 10 months. Compute for MAPE if actual demand are as follows. Period 1 2 3 4 5 6 7 8 9 сл 10 O 4.87% O Correct answer is not provided O 6.67% 5% Actual Demand 30 32 35 40 36 45 50 52 56 62


Q: Please define the distinction between distribution and logistics. Are they the same task?
A: The term distribution and logistics are somewhat different. The differences between them with one…
Q: Café Michigan's manager, Gary Stark, suspects that demand for mocha latte coffees depends on the…
A: Formulae used: Linear regression forecast: Y= a+bxwhere,b= slope of the line a= Value of Ywhere…
Q: Determine the best crop to plant, using the following decision criteria: a) Maximax b) Maximin c)…
A: NOTE: We are allowed to do the first three sub-parts only. Maximin:This is the most conservative…
Q: alculate the cost of the current ordering policy and determine the saving that could be made by…
A:
Q: Pick any 10 project management-related hazards. Give examples of project risk management and the…
A: Project Management Hazards Any possible negative or positive event during the course of a project is…
Q: 3D printing may dramatically increase the efficiency and effectiveness of an SCM. Explain on one…
A: 3D printing or commonly known as three dimensional printing can be defined as a three dimensional…
Q: Critically examine the effectiveness of product development, citing relevant examples.
A: Product development, also known as new product management, is a process that begins with an idea and…
Q: The following table gives the number of pints of type A blood used at Damascus Hospital in the past…
A: Formulae used: Simple Moving Average = (A1 + A2 + …… + An)n Weightage Moving Average = (A1×W1+…
Q: The break-even quantity in units for the manual process = ______ bags (round your response to the…
A: Note: We are allowed to do first three sub-parts only. Break-even quantity= fixed cost/ (selling…
Q: project scheduling, the critical route approach is crucial, but what does it really do?
A: Critical path is the longest path on a project network diagram. In critical route approach, the…
Q: Which of the following consists of real-time collaborative technology capabilities that enable…
A: In the twenty-first century, both identifying technologies like radio frequency identification…
Q: Mark Gershon, owner of a musical instrument distributorship, thinks that demand for guitars may be…
A: By reducing the total of the offsets or residuals of points from the plotted curve, the least…
Q: a. Compute a three-semester moving average forecast for semesters 4 through 9. b. Compute the…
A: Forecasting is a technique used to predict future outcomes on the basis of past data. In business…
Q: Adidas is an athletic company designs and manufactures several athletic things. Football is one of…
A: Given data: Selling price = 40 Fixed cost = 150000 Variable cost = 15 Target profit = 30000
Q: a. the 6th year using the weighted moving average w/weights.7&.3 b.The 6th year using Exponential…
A: Forecasting the demand or sales can be done by various methods like weighted moving averages,…
Q: Janet is providing her personal assistant services in a very competitive city. She has decided to…
A: A person Janet is offering services in a competitive city and to retain her customers she lowers her…
Q: Considering the above, mathematically formulate the freight loading plan for the Noyina as an LP…
A: Objective Functions and Constraints: Based on the given details, the objective…
Q: Compare and contrast the distributive bargaining and integrative negotiation situation. Identify the…
A: A competitive negotiating tactic known as distributive bargaining, commonly known as declaring value…
Q: Which of these are key attributes of a project? Choose two. Answer instructions It is…
A: A Project can be defined as a series of tasks that are needed to be accomplished to reach a…
Q: Briefly explain the goal of the project then discuss the importance of the following in a Project…
A: A project is defined as any endeavour undertaken to create a unique product, service or result. A…
Q: Find solution using simplex method. Maximize z = 4x₁ + 3x₂ Subject to the constraints 2x₁ + x₂ ≤…
A: Linear Programming is a mathematical and statistical technique used in operations that help…
Q: Let's say your business wants to construct a server room that is completely autonomous and has no…
A: A server room is a place where all drivers and interfaces are kept that handles the data operations…
Q: certain type of computer costs P80,000 per unit, and the annual holding cost is 25% of the per-unit…
A: Given : Annual demand (D) = 10000 Ordering cost (S) = 12000 Holding cost (H) = 80000*25% = 20000
Q: Why are enterprise resource planning systems being used as the backbone of so many multinational…
A: Enterprise resource planning is an integrated business suite that utilizes an integrated software…
Q: Describe the technologies and techniques that are utilized to make managing information technology…
A: Project management in the field of information technology is the process of leading people and tools…
Q: What effects do quality planning have on system output, performance, maintainability, reliability,…
A: The primary objective of a quality planning approach is to designing a particular process that would…
Q: What should be the pessimism value the company should consider if it is indifferent between pricing…
A: Maximin decision analysis is a type of decision-making that is based on the principle of maximizing…
Q: Using the case data, propose a breakdown for an ABC analysis, and clearly outline how each category…
A: ABC analysis or classification is an important aspect practiced in managing the inventory due to the…
Q: Simply and simply describe the idea of project scope and the impact it has on the three project…
A: The project scope is a broad definition of a project's depth, complexity and output. The linear…
Q: Describe 5 essential elements of JIT system.
A: Just-in-time is a system of inventory management in which supplies of labor, materials, and finished…
Q: Justify the need for a skilled project manager for challenging work.
A: Management of the project's timeline, resources, and budget all fall within the purview of the…
Q: What are some potential weaknesses of stakeholder theory? Can they be remedied?
A: The stakeholder theory discusses ethics and values in organisational management. R. Strategic…
Q: a) The expected (estimated) time for act weeks. (Round yo sponse b) The variance for activity C is…
A: NOTE: We are allowed to do the first three sub-parts only. The critical path is the…
Q: John and Mary work for a direct marketing firm. They make calls to customers for a local carpet…
A: The productivity of an employee within the context of operations management highlights the amount of…
Q: What is project risk management, and what are the necessary measures, and what are they
A: Since you have asked multiple questions, we will solve one question for you. If youwant any specific…
Q: 1 to 4 are based on this problem. Jack is considering purchase the following items for his…
A: Objective Functions and Constraints: Based on the given details, the objective…
Q: The manager of travel agency has been using a seasonally adjusted forecast to predict demand for…
A: MAD is the proportion between absolute errors and the number of periods. MAPE is the average value…
Q: ABC company creates specialty shipping bags that they sell to pharmaceutical companies across the…
A: Given that the 10 bundles of material can produce 12000 bags.
Q: Compute the exponentially smoothed forecast with a = 0.40, the adjusted exponentially smoothed…
A: Forecasting is predicting in advance the demand of the future. General formulas for exponential…
Q: Engineering Management 1. Assuming you are the project engineer of a certain construction project,…
A: Quality management in Construction projects comprises of putting the policies & procedures to…
Q: Solve the problem using LP Model whether excel or graphical solution
A: Given data is
Q: Which is the correct relationship between IP and its LP relaxation? a. The optimal objective value…
A: INTRODUCTION: Because we are restricting the LP with extra integer constraints that cannot enhance…
Q: Can you please solve the linear equation graphically with clear steps
A: Linear programming is a mathematical technique that is also used in operations management…
Q: How are Cp and Cpk calculated and process capabilities explained?
A: Process capability is defined as the spread of a process. Let us consider, σ =standard deviation of…
Q: ABC company creates specialty shipping bags that they sell to pharmaceutical companies across the…
A: NOTE: We are allowed to do the first three sub-parts only. Productivity = output/input Multifactor…
Q: When employing lean management strategies, maybe certain organizational effectiveness elements are…
A: Lean manufacturing is a set of practices and ideas that aim to cut down on the time it takes to…
Q: How many shipping bags does ABC produce in a standard month (20 working days)? Each workday (8…
A: Productivity measures the number of outputs produced per unit of inputs used.
Q: You have been given sales data for TOMMY's Fall/Winter/Spring/Fall New Collection for the last 4…
A: Forecasting is a technique used to predict future outcomes on the basis of past data. In business…
Q: A craftsman named William Barnes builds two kinds of birdhouses, one for wrens and a second for…
A: Graphical Method: In order to find the optimal answer to a mathematical model, a procedure known as…
Q: Lori Cook has developed the following forecasting model: where y demand for Kool Air conditioners…
A: Regression is a statistical technique used in the fields of finance, investing, and other…


Trending now
This is a popular solution!

Step by step
Solved in 3 steps

- Assume the demand for a companys drug Wozac during the current year is 50,000, and assume demand will grow at 5% a year. If the company builds a plant that can produce x units of Wozac per year, it will cost 16x. Each unit of Wozac is sold for 3. Each unit of Wozac produced incurs a variable production cost of 0.20. It costs 0.40 per year to operate a unit of capacity. Determine how large a Wozac plant the company should build to maximize its expected profit over the next 10 years.Sometimes curvature in a scatterplot can be fit adequately (especially to the naked eye) by several trend lines. We discussed the exponential trend line, and the power trend line is discussed in the previous problem. Still another fairly simple trend line is the parabola, a polynomial of order 2 (also called a quadratic). For the demand-price data in the file P13_10.xlsx, fit all three of these types of trend lines to the data, and calculate the MAPE for each. Which provides the best fit? (Hint: Note that a polynomial of order 2 is still another of Excels Trend line options.)The file P13_22.xlsx contains total monthly U.S. retail sales data. While holding out the final six months of observations for validation purposes, use the method of moving averages with a carefully chosen span to forecast U.S. retail sales in the next year. Comment on the performance of your model. What makes this time series more challenging to forecast?
- Use @RISK to analyze the sweatshirt situation in Problem 14 of the previous section. Do this for the discrete distributions given in the problem. Then do it for normal distributions. For the normal case, assume that the regular demand is normally distributed with mean 9800 and standard deviation 1300 and that the demand at the reduced price is normally distributed with mean 3800 and standard deviation 1400.Dilberts Department Store is trying to determine how many Hanson T-shirts to order. Currently the shirts are sold for 21, but at later dates the shirts will be offered at a 10% discount, then a 20% discount, then a 40% discount, then a 50% discount, and finally a 60% discount. Demand at the full price of 21 is believed to be normally distributed with mean 1800 and standard deviation 360. Demand at various discounts is assumed to be a multiple of full-price demand. These multiples, for discounts of 10%, 20%, 40%, 50%, and 60% are, respectively, 0.4, 0.7, 1.1, 2, and 50. For example, if full-price demand is 2500, then at a 10% discount customers would be willing to buy 1000 T-shirts. The unit cost of purchasing T-shirts depends on the number of T-shirts ordered, as shown in the file P10_36.xlsx. Use simulation to determine how many T-shirts the company should order. Model the problem so that the company first orders some quantity of T-shirts, then discounts deeper and deeper, as necessary, to sell all of the shirts.Play Things is developing a new Lady Gaga doll. The company has made the following assumptions: The doll will sell for a random number of years from 1 to 10. Each of these 10 possibilities is equally likely. At the beginning of year 1, the potential market for the doll is two million. The potential market grows by an average of 4% per year. The company is 95% sure that the growth in the potential market during any year will be between 2.5% and 5.5%. It uses a normal distribution to model this. The company believes its share of the potential market during year 1 will be at worst 30%, most likely 50%, and at best 60%. It uses a triangular distribution to model this. The variable cost of producing a doll during year 1 has a triangular distribution with parameters 15, 17, and 20. The current selling price is 45. Each year, the variable cost of producing the doll will increase by an amount that is triangularly distributed with parameters 2.5%, 3%, and 3.5%. You can assume that once this change is generated, it will be the same for each year. You can also assume that the company will change its selling price by the same percentage each year. The fixed cost of developing the doll (which is incurred right away, at time 0) has a triangular distribution with parameters 5 million, 7.5 million, and 12 million. Right now there is one competitor in the market. During each year that begins with four or fewer competitors, there is a 25% chance that a new competitor will enter the market. Year t sales (for t 1) are determined as follows. Suppose that at the end of year t 1, n competitors are present (including Play Things). Then during year t, a fraction 0.9 0.1n of the company's loyal customers (last year's purchasers) will buy a doll from Play Things this year, and a fraction 0.2 0.04n of customers currently in the market ho did not purchase a doll last year will purchase a doll from Play Things this year. Adding these two provides the mean sales for this year. Then the actual sales this year is normally distributed with this mean and standard deviation equal to 7.5% of the mean. a. Use @RISK to estimate the expected NPV of this project. b. Use the percentiles in @ RISKs output to find an interval such that you are 95% certain that the companys actual NPV will be within this interval.
- Assume the weight is 0.6 for the most recent period; 0.2 for the second most recent; 0.1 for the third most recent; and 0.1 for the fourth most recent period. Using the four-period weighted moving average technique to predict the demand in February 2019. Find the X and Y values. Dt Ft Period Demand Four-period weighted Moving Average 2014 September 9400 October 10300 November 11200 December 4998 2015 January 9800 7209 February 9555 X March 9800 Y Group of answer choices X = 9899.8; Y = 9778.2 X = 9312.8; Y = 9555.2 X = 9029.6; Y = 9312.8 X = 9555.0; Y = 9313.7 X = 9872.4; Y = 9029.4The table below comprises of demand from the last 10 months: Month Demand 1 31 2 34 3 33 4 35 5 37 6 36 7 38 8 40 9 40 10 41 Calculate the exponential smoothing with trend forecast for the second month using a alpha and delta of 0.3 each. Take the initial exponentially smoothed forecast (F1) of 30 and initial trend forecast (T1) of 1. Note: I have tried solving this question and I got 31, but unfortunately it was the wrong answer.Use Excel to make calculations Given the following sales data: Quarter Year 1 Year 2 1 120 150 2 160 200 3 210 250 4 130 170 Compute the seasonal index for each quarter and forecast quarterly demand for year 3 with a projected annual demand of 1000. The efficiency of a production unit is 70 percent. The unit produces an average of 100 products per day. Determine the effective capacity of the unit. The utilization of a machine is 60 percent. The machine has a design capacity of 150 units per hour and an effective capacity of 100 units per hour. Find the efficiency of the machine. FloorsRUs is considering new locations for its manufacturing plants. Costs for constructing a new facility in Huntsville are $1,100,000 and the company estimates that for every product from its new line, there would be an additional cost of $3. If the company were to locate in Hays, the new facility would cost $1,800,000 and each product would incur a $2…
- North Dakota Electric Company estimates its demand trend line (in millions of kilowatt hours) to be: D = 80.0 + 0.43Q, where Q refers to the sequential quarter number and Q = 1 for winter of Year 1. In addition, the multiplicative seasonal factors are as follows: Quarter Factor (Index) Winter 0.80 Spring 1.25 Summer 1.45 Fall 0.50 In year 26 (quarters 101-104), the energy use for each of the quarters beginning with winter is (round your response to one decimal place): Quarter Energy Use Winter 98.798.7 Spring nothingDemand forecasting is the art and science of predicting future market demand.Select one:a. Trueb. FalseNorth Dakota Electric Company estimates its demand trend line (in millions of kilowatt hours) to be: D = 80.0 + 0.43Q, where Q refers to the sequential quarter number and Q = 1 for winter of Year 1. In addition, the multiplicative seasonal factors are as follows: Quarter Factor (Index) Winter 0.80 Spring 1.25 Summer 1.45 Fall 0.50 In year 26 (quarters 101-104), the energy use for each of the quarters beginning with winter is (round your response to one decimal place):