A mathematics teacher wanted to see the correlation between test scores and homework. The homework grade (x) and test grade (y) are given in the accompanyir table. Write the linear regression equation that represents this set of data, rounding all coefficients to the nearest tenth. Using this equation, estimate the homework grade, to the nearest integer, for a student with a test grade of 87.
A mathematics teacher wanted to see the correlation between test scores and homework. The homework grade (x) and test grade (y) are given in the accompanyir table. Write the linear regression equation that represents this set of data, rounding all coefficients to the nearest tenth. Using this equation, estimate the homework grade, to the nearest integer, for a student with a test grade of 87.

Glencoe Algebra 1, Student Edition, 9780079039897, 0079039898, 2018
18th Edition
ISBN:9780079039897
Author:Carter
Publisher:Carter
Chapter4: Equations Of Linear Functions
Section4.6: Regression And Median-fit Lines
Problem 17HP

Related questions
Question
Transcribed Image Text:80
* DeltaMath
Itamath.com/app/student/solve/14923198/linearRegression
Linear Regressions
Dec 16, 3:58:59 PM
Watch help video
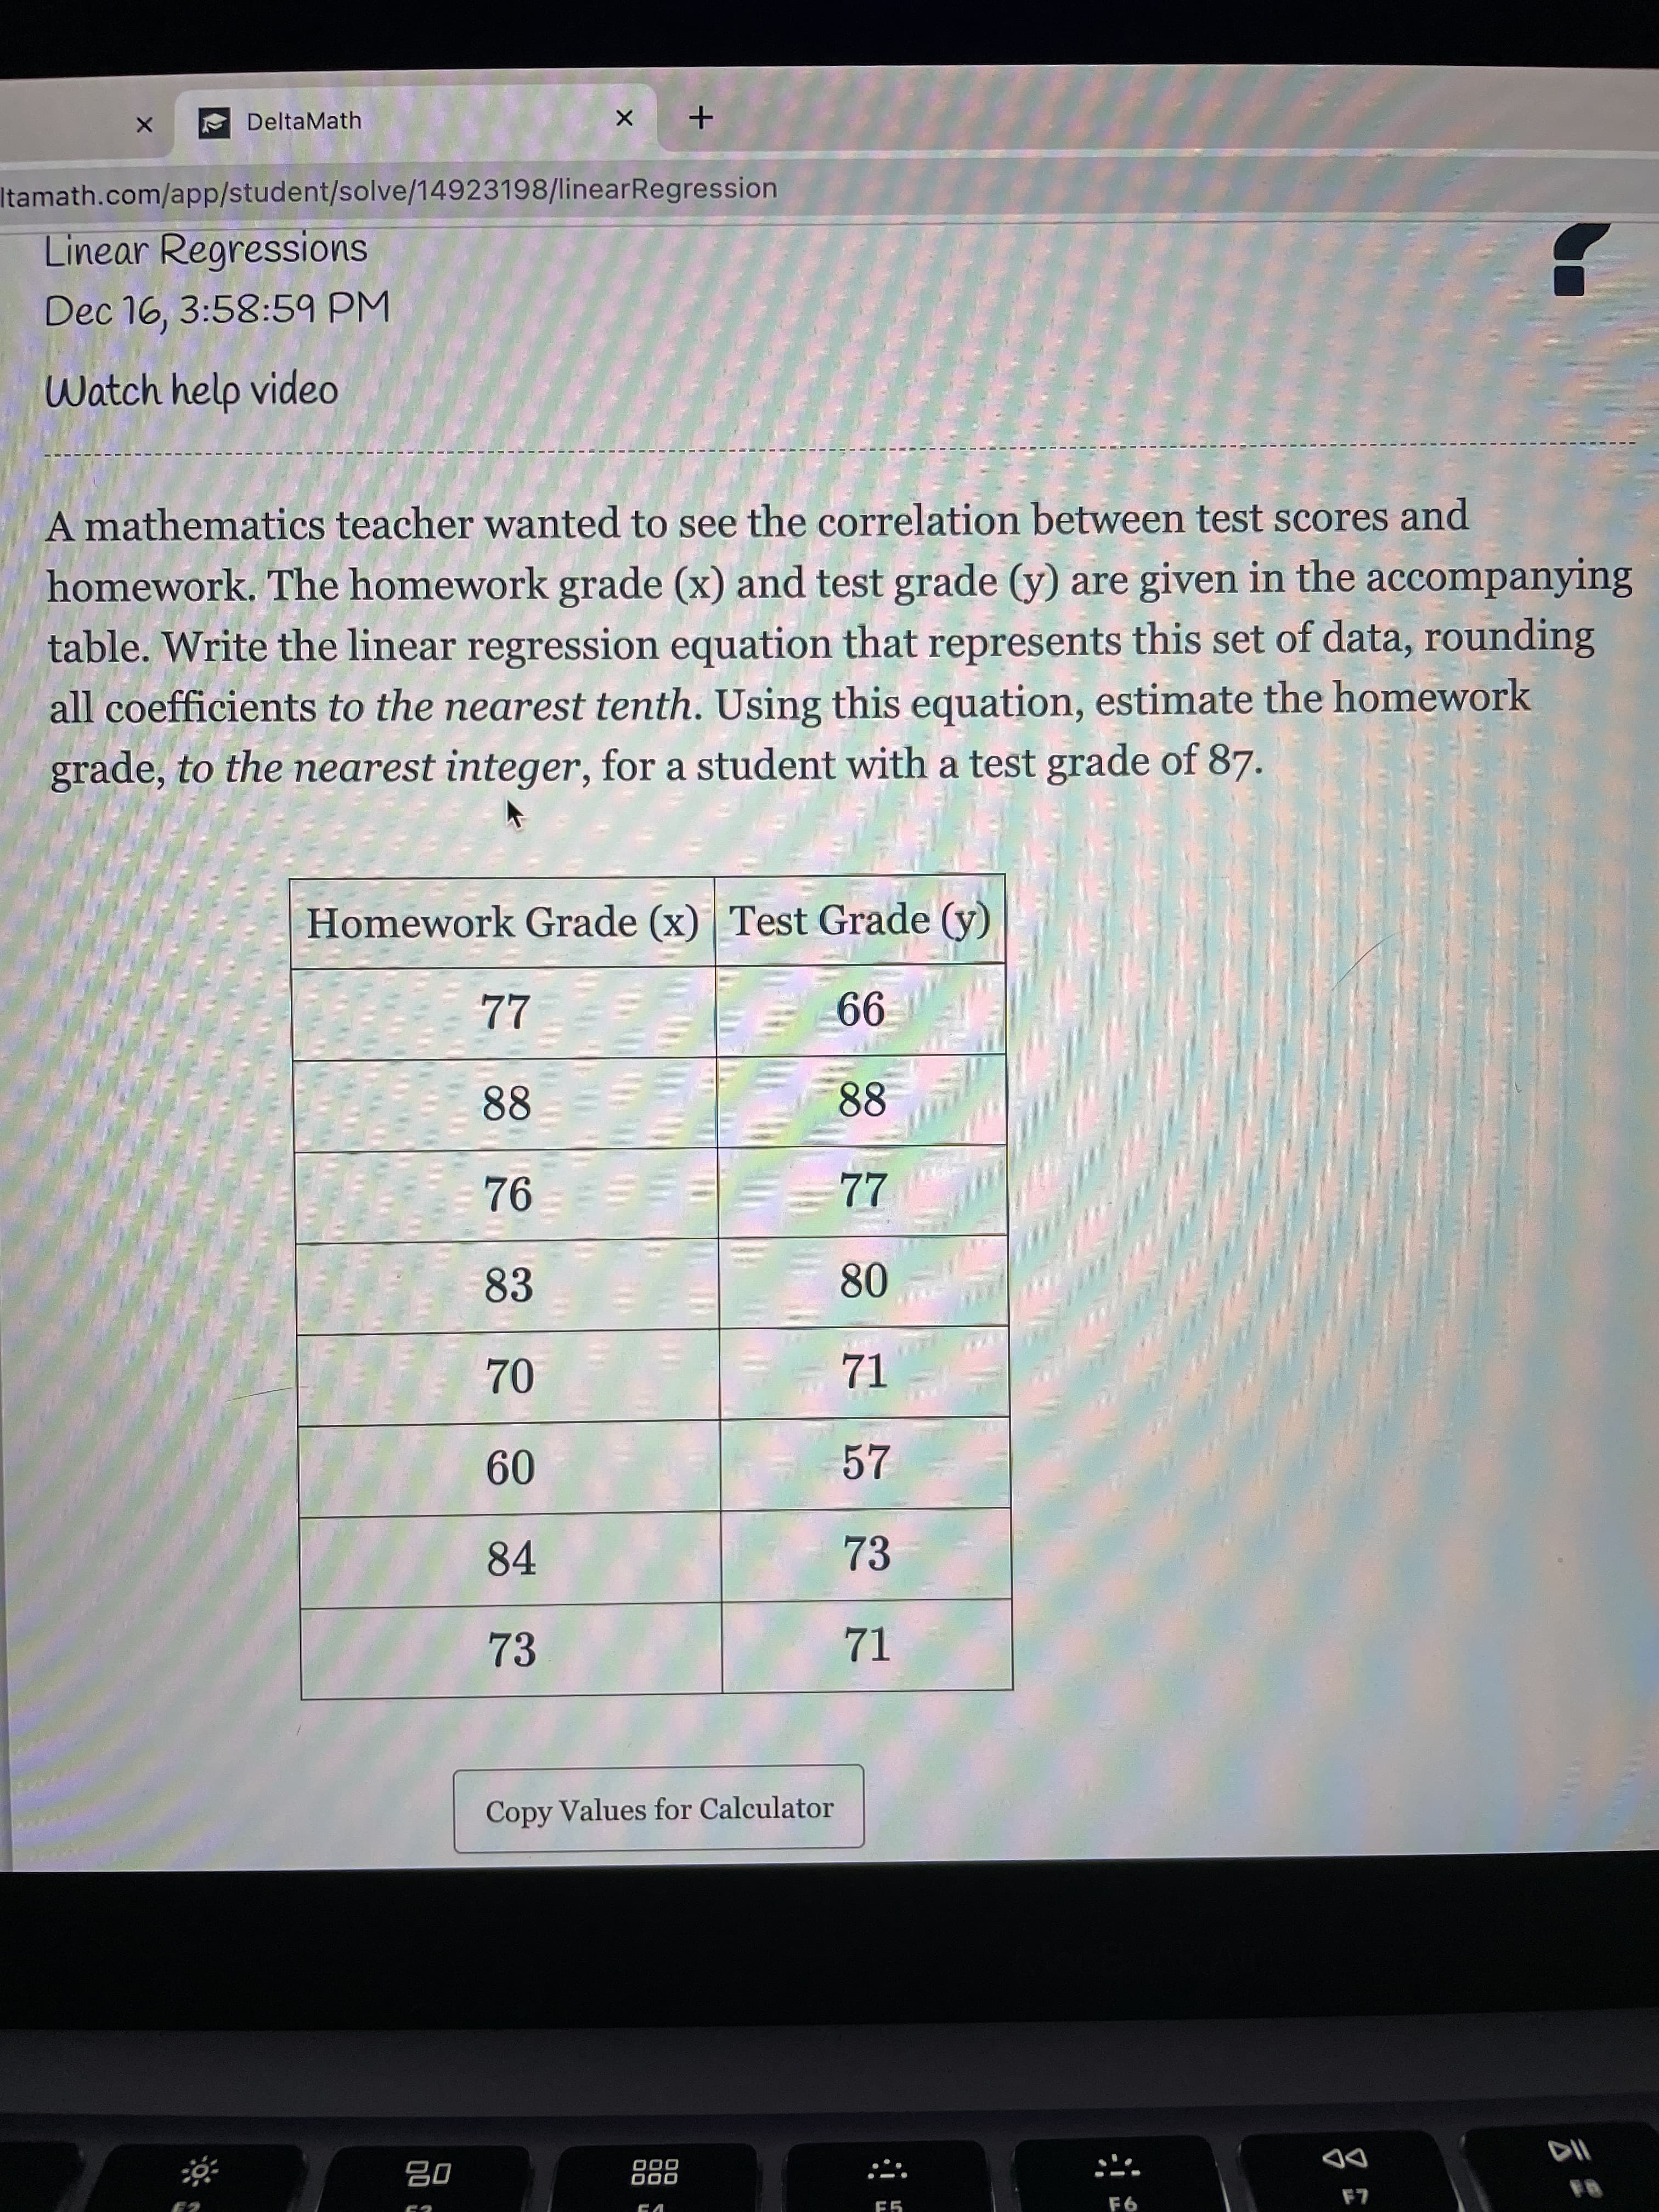
A mathematics teacher wanted to see the correlation between test scores and
homework. The homework grade (x) and test grade (y) are given in the accompanying
table. Write the linear regression equation that represents this set of data, rounding
all coefficients to the nearest tenth. Using this equation, estimate the homework
grade, to the nearest integer, for a student with a test grade of 87.
Homework Grade (x) Test Grade (y)
77
99
88
88
94
22
83
71
09
84
73
73
Copy Values for Calculator
000
000
DD
LA
Expert Solution
This question has been solved!
Explore an expertly crafted, step-by-step solution for a thorough understanding of key concepts.

This is a popular solution!

Trending now
This is a popular solution!

Step by step
Solved in 3 steps with 3 images

Recommended textbooks for you
Glencoe Algebra 1, Student Edition, 9780079039897…
Algebra
ISBN:
9780079039897
Author:
Carter
Publisher:
McGraw Hill

Algebra & Trigonometry with Analytic Geometry
Algebra
ISBN:
9781133382119
Author:
Swokowski
Publisher:
Cengage

College Algebra
Algebra
ISBN:
9781305115545
Author:
James Stewart, Lothar Redlin, Saleem Watson
Publisher:
Cengage Learning
Glencoe Algebra 1, Student Edition, 9780079039897…
Algebra
ISBN:
9780079039897
Author:
Carter
Publisher:
McGraw Hill
Algebra & Trigonometry with Analytic Geometry
Algebra
ISBN:
9781133382119
Author:
Swokowski
Publisher:
Cengage
College Algebra
Algebra
ISBN:
9781305115545
Author:
James Stewart, Lothar Redlin, Saleem Watson
Publisher:
Cengage Learning

Functions and Change: A Modeling Approach to Coll…
Algebra
ISBN:
9781337111348
Author:
Bruce Crauder, Benny Evans, Alan Noell
Publisher:
Cengage Learning

Big Ideas Math A Bridge To Success Algebra 1: Stu…
Algebra
ISBN:
9781680331141
Author:
HOUGHTON MIFFLIN HARCOURT
Publisher:
Houghton Mifflin Harcourt