A population of animals oscillates between a low of 1100 on January 1 (t = 0 ) and a high of 2000 on July 1 (t = 6 ). The population doesn't reach this high before July 1. (a) Find a formula for the population, P, in terms of the time, t, in months. Assume there is no phase shift. Use "pi" or symbol n to enter the n. P(t) = ? Edit (b) Interpret the amplitude, period, and midline of the function P = f(t). Amplitude = This is the amount that the population varies above and below the average v population. Period = months.
A population of animals oscillates between a low of 1100 on January 1 (t = 0 ) and a high of 2000 on July 1 (t = 6 ). The population doesn't reach this high before July 1. (a) Find a formula for the population, P, in terms of the time, t, in months. Assume there is no phase shift. Use "pi" or symbol n to enter the n. P(t) = ? Edit (b) Interpret the amplitude, period, and midline of the function P = f(t). Amplitude = This is the amount that the population varies above and below the average v population. Period = months.

Algebra & Trigonometry with Analytic Geometry
13th Edition
ISBN:9781133382119
Author:Swokowski
Publisher:Swokowski
Chapter5: Inverse, Exponential, And Logarithmic Functions
Section: Chapter Questions
Problem 18T

Related questions
Question
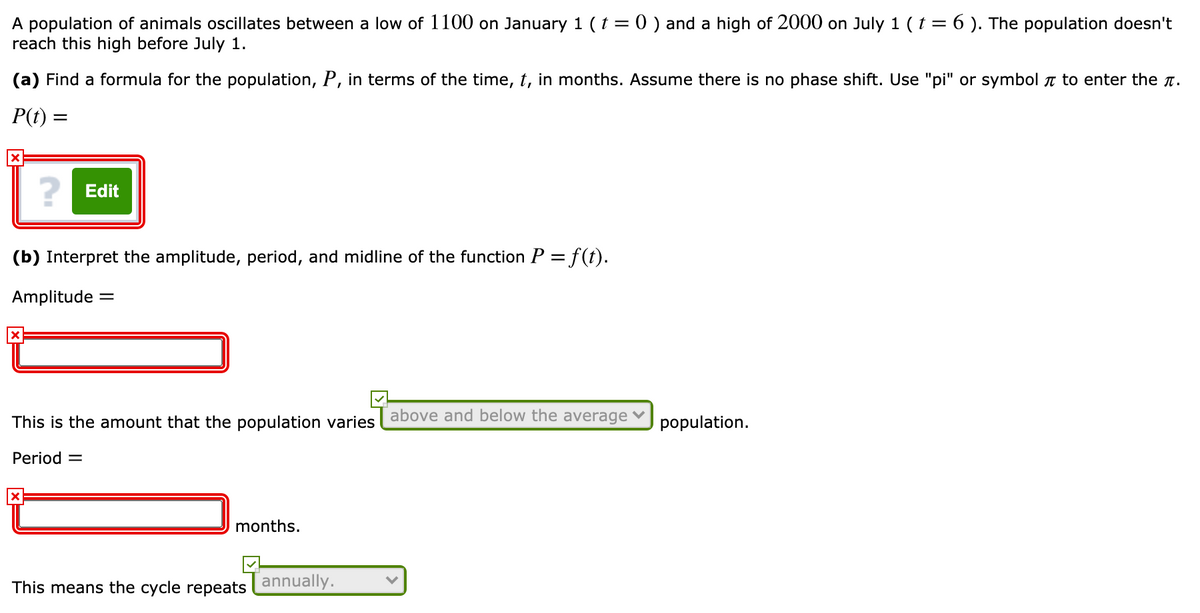
Transcribed Image Text:A population of animals oscillates between a low of 1100 on January 1 ( t = 0 ) and a high of 2000 on July 1 (t = 6 ). The population doesn't
reach this high before July 1.
(a) Find a formula for the population, P, in terms of the time, t, in months. Assume there is no phase shift. Use "pi" or symbol r to enter the n.
P(t) =
? Edit
(b) Interpret the amplitude, period, and midline of the function P = f(t).
Amplitude =
This is the amount that the population varies above and below the average
population.
Period =
months.
This means the cycle repeats annually.
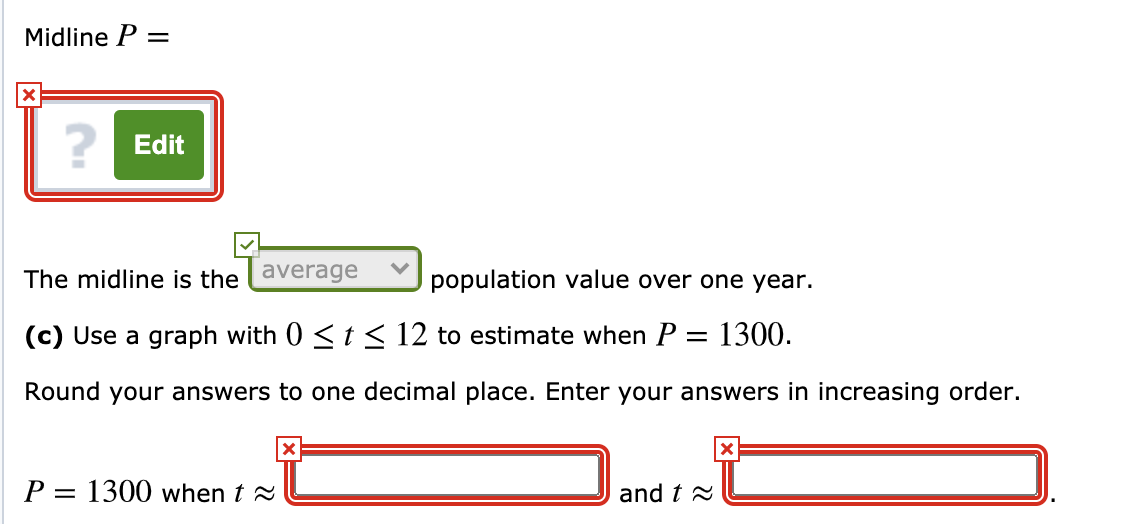
Transcribed Image Text:Midline P
Edit
The midline is the average
population value over one year.
(c) Use a graph with 0 <t< 12 to estimate when P = 1300.
Round your answers to one decimal place. Enter your answers in increasing order.
P = 1300 when t 2
and t 2
Expert Solution
This question has been solved!
Explore an expertly crafted, step-by-step solution for a thorough understanding of key concepts.

This is a popular solution!

Trending now
This is a popular solution!

Step by step
Solved in 4 steps

Knowledge Booster


Learn more about
Need a deep-dive on the concept behind this application? Look no further. Learn more about this topic, calculus and related others by exploring similar questions and additional content below.Recommended textbooks for you
Algebra & Trigonometry with Analytic Geometry
Algebra
ISBN:
9781133382119
Author:
Swokowski
Publisher:
Cengage

Linear Algebra: A Modern Introduction
Algebra
ISBN:
9781285463247
Author:
David Poole
Publisher:
Cengage Learning
Algebra & Trigonometry with Analytic Geometry
Algebra
ISBN:
9781133382119
Author:
Swokowski
Publisher:
Cengage
Linear Algebra: A Modern Introduction
Algebra
ISBN:
9781285463247
Author:
David Poole
Publisher:
Cengage Learning