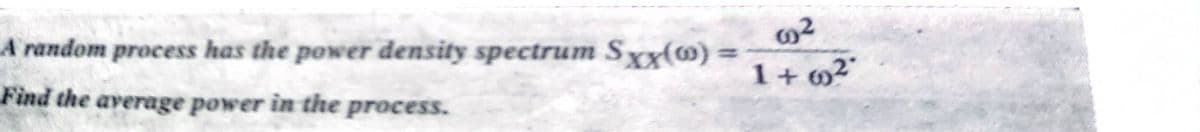
A random process has the power density spectrum Sxx(@) = %3D 1+ m2" Find the average power in the process.


Q: Find the area under the standard normal curve to the right of z=1
A: Given: z = 1 Area greater than 1
Q: Suppose that X has a beta distribution with parameters a and ß. Determine EX"(1– X)s, where r and s…
A:
Q: Suppose that the probability density function of the length of computer cables is f (x) = 2x/(52)…
A: Let X be the continuous random variable which denotes the length of the computer cables. The…
Q: A straight line is drawn at random through a point (0, 1) (Figure 22). Find the probability density…
A: answer is in next step.
Q: The velocity v of an object of mass m = 5 Kg is a random variable with probability density function…
A: We have to find correct answer..
Q: A manufacturer produces laptops with variable quality. In fact, for each laptop, its quality level A…
A: Here, fλ=βαταλα-1e-βλ
Q: In certain experiments, the error made in determiningthe density of a substance is a random variable…
A: Births are uniform (-0.015, 0.015). That is,
Q: A test instrument needs to be calibrated periodically to prevent measurement errors. After some time…
A: Solution According to guide lines we solve only first question
Q: An estimate of the population mean is . The standard error is . The distribution is…
A: We have given that Average breaking strength of 6.68 psi and a standard deviation of s = 0.75 psi.…
Q: A factory produces (cylindrically shaped) roller bearings that are sold as having diameter 4.0 cm…
A: Given the following information- X ~ N(4.0,0.01)Y ~…
Q: What is the probability that the lifetime X of the first component exceeds 3? What are the marginal…
A: Given, To find: The probability of the first component exceeds 3 The given function is independent…
Q: Shade the corresponding region under the standard normal density curve below. 0.47 0.3- 0.2- 0.1- 9
A:
Q: find the area under the standard normal curve that lies to the right of:
A: g. The standard normal variable is z, which follows the normal distribution with the mean of 0 and…
Q: Suppose X1, X2, X3 denote a random sample from the exponential distribution with density function.…
A: A continuous random variable X is said to follow the exponential distribution if its probability…
Q: Among all distribution laws of a continuous random variable X with the same known variation D, find…
A:
Q: Find the area under the standard normal curve between z =-2.07 and z= 0 %3D
A: Given that Area under Z standard normal curve between Z=-2.07 , Z=0
Q: Give an efficient method to generate a random variable X having density f(x) = 1 ¤(1– x)*,0.8 < æ <…
A: Given that : f(x) = 10.000336x1-x3 , 0.8<x<1f(0.8)=10.0003360.81-0.8…
Q: The velocity v of an object of mass m = 5 Kg is a random variable with probability density function…
A: fv = 11.21.8≤v30 otherwisey = 12mv2dy = 12.m.2v dvdy = mv dv
Q: Find the area under the standard normal curve to the right of z = 1.67.
A:
Q: The actual tracking weight of a stereo cartridge that is set to track at 3 g on a particular changer…
A: Assume, X be the continuous random variable representing the actual tracking weight of a stereo…
Q: Suppose that the lifespan, in years, of a cheap light bulb is a random variable whose probabily…
A:
Q: In a certain experiment, the error made in determining the density of a substance is evenly…
A: Introduction: Denote X as the random variable representing the error made in determining the density…
Q: Consider the random variable model with density function given by f(x) ={2kx⁄45 , 0 ≤ x ≤ 15 2k(30…
A: Image is attached with detailed solution.
Q: Determine the area under the standard normal curve to the right of z = 0.35.
A:
Q: Find the area under the standard normal curve which lies to the left of z = 0.72
A: We have to find left of .72
Q: The article “Monte Carlo Simulation—Tool for Better Understanding of LRFD” (J. of Structural Engr.,…
A: It is given that the mean is 50.2 and standard deviation is 3.8.
Q: find the area to the right of z=-0.71 under standard normal curve
A:
Q: Find the area under the standard normal curve to the right of z = 2.
A: Solution: The area under the curve to the right of Z = 2 is: P(Z>2) =1-P(z<2) From z-table, P…
Q: The power spectral density of a stationary random process is given by [A Sxx (@) -K<ω< Κ XX…
A:
Q: A certain insect species has a mean length of 1.2 centimeters and a standard deviation of 0.1…
A: 1. The Z-score of a random variable X is defined as follows: Z = (X – µ)/σ. Here, µ and σ are the…
Q: show how to generate random variables from a uniform density on an interval (a,b)
A: In the given problem we have to answer the question of, how to generate random variables from a…
Q: Find the z score if the NON-shaded region indicated by the arrow is 0091 Round to 4 decimal places…
A: Since we only answer up to 3 sub-parts, we’ll answer the first 3. Please resubmit the question and…
Q: Find the area under the normal curve with parameters mu=64.4 and sigma=2.4 that lies to the right of…
A: Normal distribution is a continuous distribution which has many real life applications. Normal curve…
Q: Find the area under the standard normal curve to the right of z=0.52 using excel please
A: First of all we write Shaded to the right shaded to the right Z = 0.52 P(z) = NORMSDIST(col number)…
Q: Find Joint Density function of i-th & j-th order statistics in Uniform Distribution
A: From the general properties of order statistics, the joint density funtion of ith and jth order…
Q: Find the area under the standard normal curve between z - 2.33 and z = 2.33. Round your answer to…
A: Answer - Find the area under the standard normal curve between Z1 = -2.33 and Z2 =…
Q: Consider the experiment of drawing a point uniformly at random from the unit interval [0, 1]. Let Y…
A: The answer is attached below,
Q: Find the area under the standard normal curve to the right of z =-1.25. (Round to 4 decimal places)
A:
Q: find the area under the standard normal curve from 0 to −1.62.
A: We want to find the area under the standard normal curve from 0 to −1.62.
Q: Let the continuous random variable X denote the distance in micrometers from the start of a track on…
A: Exponential distribution: A continuous r.v. X taking non-negative values is said to follow an…
Q: Find the area under the normal curve to the right of z=0.68
A: Given data: Find the area under the normal curve to the right of z=0.68
Q: that a certa heavy equipment can be used before it fails beyond repair is variable having the…
A: We are given a probability density function, say f(x). P(X≥x) = ∫x∞f(x)dx P(a≤x≤b) = ∫abf(x)dx
Q: Find the area below the standard normal curve to the right of z = 0.2
A: Required probability is P(Z>0.2)
Q: Let x be a continuous random variable that follows a normal distribution with a mean of 550 and a…
A: Given: Population mean μ=550 Population standard deviation σ=75 Let X ~ N (550, 752)
Q: |The amount of electricity consumed (in kWh) on a randomly chosen day in a warehouse can be modelled…
A: Let , the random variable X be the amount of electricity consumed on a randomly chosen day in…
Q: In an experiment held at European Centre for Nuclear Research (CERN), subatomic particles are…
A: The mean is 210 and the standard deviation is 60.
Q: Shade the corresponding region under the standard normal density curve below.
A: Let X denote the normally distributed random variable with mean = -1 and SD = 2
Q: A test instrument needs to be calibrated periodically to prevent measurement errors. After some time…
A: # Given: x be the measurement error and pdf of x : f(x)=1-0.5*x : 0<x<2 then to find…

Step by step
Solved in 2 steps with 2 images

- Later, when the medical devices are in full production, a consultant advised that the breaking strength of these devices should not be less than 5.5 psi (pounds per square inch) on average. In the latest batch produced, a technician has noticed a visual defect that may affect the breaking strength of the devices. To investigate, a sample of 8 devices are randomly selected from the batch and the pressure at which they break are recorded as : 6.6, 7.7, 8.0, 6.3, 6.1, 6.3, 6.3, 6.1 these are summarized as having an average breaking strength of 6.68 psi and a standard deviation of s = 0.75 psi. Test, at significance level α = 0.05, whether there is evidence that the average breaking strength of the batch of devices is less than the required breaking strength, by testing the hypotheses: H 0: μ = 5.5 psi H a: μ < 5.5 psi. An estimate of the population mean is . The standard error is . The distribution is (examples: normal / t12 / chisquare4 / F5,6). The test statistic has value TS=…A. The approximate standard deviation for the area under a gaussian curve for a population in the figure is .........The total area under the curve is 1 b) If 3% of electric bulbs manufactured by a company are defective find the probability that a sample of 100 bulbs will contain: No defective bulb
- If a dealer’s profit, in units of $5000, on a new automobile can be looked upon as a random variable X having the density function Find the variance of X.The probability density function of the random variable X is as in the picture with λ> 0. Find the moments estimator (λ^) of the parameter λ.Demonstrate the density function of the continuous uniform distribution from the data presented in the image.
- Suppose that the lifetime X (in hours) of a certain type of flashlight battery is a random variable on the interval 30 ≤ x ≤ 50 with density function f(x) = 1/20, 30 ≤ x ≤ 50. Find the probability that a battery selected at random will last at least 35 hours.In kurtosis, the bell shaped distribution called mesokurtic if the frequency looks more peaked than normal. True or false?The probability density function of the random variable X is as in the picture with λ> 0. Find the maximum likelihood estimator (λ^) of the parameter λ.
- The molecular weight of a particular polymer should fall between 750 and 1,035. Thirty samples of this material were analyzed with the results X-bar = 902 and s = 90. Assume that molecular weight is normally distributed.A discrete random variable X has probability mass function X 0 1 2 3 4 P(x) 0.1 0.2 0.2 0.2 0.3 Use the inverse transform method to generate a random sample of size 1000 from the distribution of X. Construct a relative frequency table and compare with the theoretical values.If X has a uniform density with α = 0 and β = 1, show that the random variable Y = −2. In X has a gamma dis-tribution. What are its parameters?
