A researcher wants to determine the causal relationship among number of family members who are at least high school graduate (W), number of working family members (X), monthly gross income (Y), monthly expenditure (Z), and average monthly bank deposits (A). A random sample of 20 families was selected and the data on the variables were collected: Consider the following path diagram Consider the R outputs from the conducted path analysis. c. Identify the factors affecting the endogenous variables. Leave blank if variable is exogenous. W: X: Y: Z: A: d. Illustrate the output path diagram including the estimated path coefficients
A researcher wants to determine the causal relationship among number of family members who are at least high school graduate (W), number of working family members (X), monthly gross income (Y), monthly expenditure (Z), and average monthly bank deposits (A). A random sample of 20 families was selected and the data on the variables were collected: Consider the following path diagram Consider the R outputs from the conducted path analysis. c. Identify the factors affecting the endogenous variables. Leave blank if variable is exogenous. W: X: Y: Z: A: d. Illustrate the output path diagram including the estimated path coefficients

Trigonometry (MindTap Course List)
10th Edition
ISBN:9781337278461
Author:Ron Larson
Publisher:Ron Larson
ChapterP: Prerequisites
Section: Chapter Questions
Problem 8PS

Related questions
Question
A researcher wants to determine the causal relationship among number of family members who are at least high school graduate (W), number of working family members (X), monthly gross income (Y), monthly expenditure (Z), and average monthly bank deposits (A). A random sample of 20 families was selected and the data on the variables were collected: Consider the following path diagram
Consider the R outputs from the conducted path analysis.
c. Identify the factors affecting the endogenous variables. Leave blank if variable is exogenous.
W:
X:
Y:
Z:
A:
d. Illustrate the output path diagram including the estimated path coefficients.
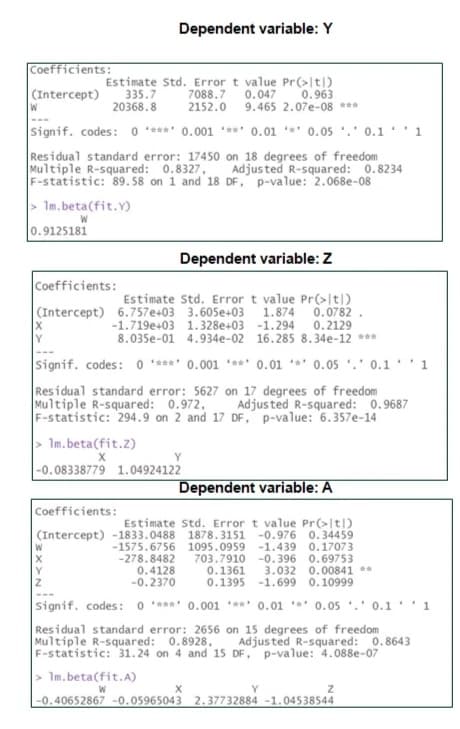
Transcribed Image Text:Dependent variable: Y
Coefficients:
(Intercept)
W
Estimate Std. Error t value Pr(>ltl)
0.963
2152.0 9.465 2.07e-08 ***
7088.7 0.047
335.7
20368.8
Signif. codes: 0 ***** 0.001 *** 0.01 *** 0.05 '.' 0.1' 1
Residual standard error: 17450 on 18 degrees of freedom
Multiple R-squared: 0.8327,
F-statistic: 89. 58 on 1 and 18 DF, p-value: 2.068e-08
Adjusted R-squared: 0.8234
> Im.beta(fit.Y)
W
0.9125181
Dependent variable: Z
Coefficients:
Estimate Std. Error t value Pr(>|t|)
|(Intercept) 6.757e+03 3.605e+03 1.874 0.0782 .
-1.719e+03 1.328e+03 -1.294 0.2129
8.035e-01 4.934e-02 16.285 8.34e-12 ***
Y
Signif. codes: 0 ***** 0.001 *** 0.01 **' 0.05 '.' 0.1'1
Residual standard error: 5627 on 17 degrees of freedom
Multiple R-squared: 0.972, Adjusted R-squared: 0.9687
F-statistic: 294.9 on 2 and 17 DF, p-value: 6.357e-14
> Im.beta(fit.Z)
Y
|-0.08338779 1.04924122
Dependent variable: A
Coefficients:
Estimate Std. Error t value Pr(>|t|)
(Intercept) -1833.0488 1878.3151 -0.976 0.34459
-1575.6756 1095.0959 -1.439 0.17073
703.7910 -0.396 0.69753
3.032 0.00841 **
0.1395 -1.699 0.10999
-278.8482
0.4128
-0.2370
Y
0.1361
signif. codes: 0 *** 0.001 **** 0.01 ** 0.05 '.' 0.1 '1
Residual standard error: 2656 on 15 degrees of freedom
Multiple R-squared: 0.8928,
F-statistic: 31.24 on 4 and 15 DF, p-value: 4.088e-07
Adjusted R-squared: 0.8643
> Im.beta(fit.A)
Y
-0.40652867 -0.05965043 2.37732884 -1.04538544
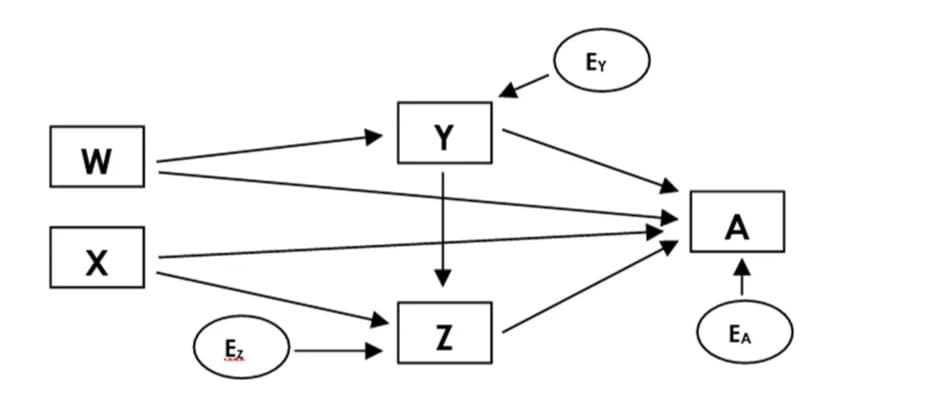
Transcribed Image Text:EY
Y
W
A
Z
EA
Ez
Expert Solution
This question has been solved!
Explore an expertly crafted, step-by-step solution for a thorough understanding of key concepts.

Step by step
Solved in 3 steps with 2 images

Recommended textbooks for you
Trigonometry (MindTap Course List)
Trigonometry
ISBN:
9781337278461
Author:
Ron Larson
Publisher:
Cengage Learning

Algebra & Trigonometry with Analytic Geometry
Algebra
ISBN:
9781133382119
Author:
Swokowski
Publisher:
Cengage

Functions and Change: A Modeling Approach to Coll…
Algebra
ISBN:
9781337111348
Author:
Bruce Crauder, Benny Evans, Alan Noell
Publisher:
Cengage Learning
Trigonometry (MindTap Course List)
Trigonometry
ISBN:
9781337278461
Author:
Ron Larson
Publisher:
Cengage Learning
Algebra & Trigonometry with Analytic Geometry
Algebra
ISBN:
9781133382119
Author:
Swokowski
Publisher:
Cengage
Functions and Change: A Modeling Approach to Coll…
Algebra
ISBN:
9781337111348
Author:
Bruce Crauder, Benny Evans, Alan Noell
Publisher:
Cengage Learning

College Algebra
Algebra
ISBN:
9781305115545
Author:
James Stewart, Lothar Redlin, Saleem Watson
Publisher:
Cengage Learning

Algebra and Trigonometry (MindTap Course List)
Algebra
ISBN:
9781305071742
Author:
James Stewart, Lothar Redlin, Saleem Watson
Publisher:
Cengage Learning