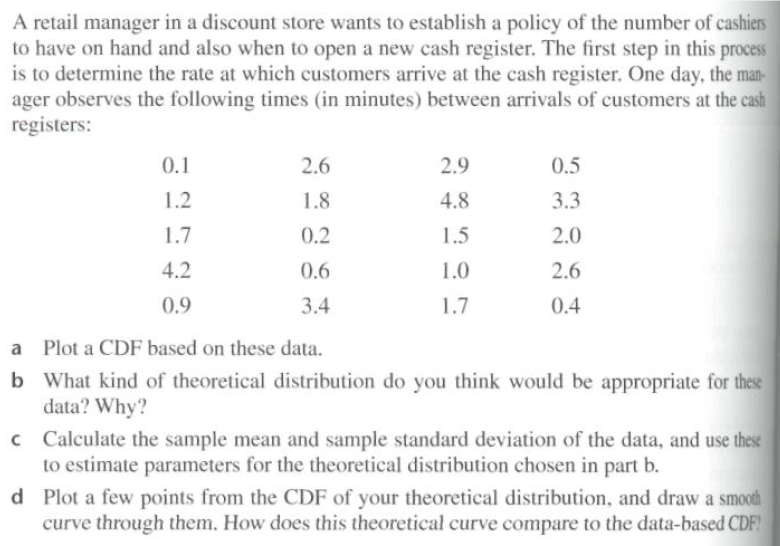
A retail manager in a discount store wants to establish a policy of the number of cashiers to have on hand and also when to open a new cash register. The first step in this proces is to determine the rate at which customers arrive at the cash register. One day, the man- ager observes the following times (in minutes) between arrivals of customers at the cash registers:
A retail manager in a discount store wants to establish a policy of the number of cashiers to have on hand and also when to open a new cash register. The first step in this proces is to determine the rate at which customers arrive at the cash register. One day, the man- ager observes the following times (in minutes) between arrivals of customers at the cash registers:

Chapter12: Sequences, Series And Binomial Theorem
Section12.3: Geometric Sequences And Series
Problem 12.58TI: What is the total effect on the economy of a government tax rebate of $500 to each household in...

Related questions
Question
Transcribed Image Text:A retail manager in a discount store wants to establish a policy of the number of cashiers
to have on hand and also when to open a new cash register. The first step in this process
is to determine the rate at which customers arrive at the cash register. One day, the man-
ager observes the following times (in minutes) between arrivals of customers at the cash
registers:
0.1
2.6
2.9
0.5
1.2
1.8
4.8
3.3
1.7
0.2
1.5
2.0
4.2
0.6
1.0
2.6
0.9
3.4
1.7
0.4
a Plot a CDF based on these data.
b What kind of theoretical distribution do you think would be appropriate for these
data? Why?
c Calculate the sample mean and sample standard deviation of the data, and use these
to estimate parameters for the theoretical distribution chosen in part b.
d Plot a few points from the CDF of your theoretical distribution, and draw a smooth
curve through them. How does this theoretical curve compare to the data-based CDF?
Expert Solution
This question has been solved!
Explore an expertly crafted, step-by-step solution for a thorough understanding of key concepts.

This is a popular solution!

Trending now
This is a popular solution!

Step by step
Solved in 4 steps with 4 images

Recommended textbooks for you