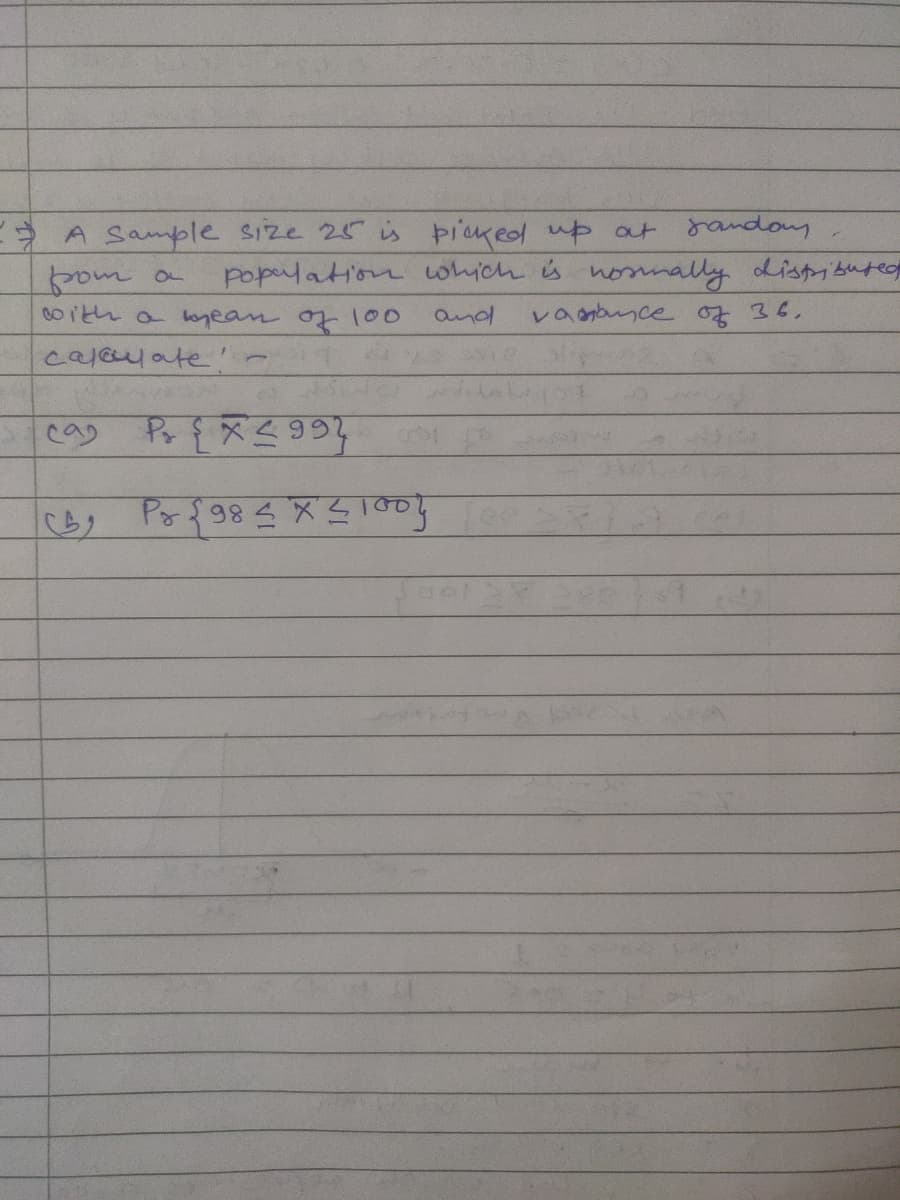
A Sample sIze 25 is pie pom a pith a ogean of 100 population wh an 99


Q: distribution the sampling if the sample si3e is n=9 of the populaton from wi Round to the nec arst…
A: We are given the sampling distribution of the sample mean, so we know the mean of the sample mean as…
Q: In a table create a Random sample with a sample size of 10 values between 1 and 20 in column A. Copy…
A: We will use the rand function in Excel to generate random numbers of sample size n = 10
Q: Big Blossom Greenhouse was commissioned to develop an extra large rose for the Rose Bowl Parade. A…
A: Given information- Sample size, n = 6 The given sample is- 2 in, 3 in, 3 in, 8 in, 10 in, 10 in
Q: 10. Randomly selected seventh graders in two classes are each asked to measure the entire length of…
A: Note: " Since you have posted many sub-parts. we will solve the first three sub-parts for you. To…
Q: answers to the questions, identify which question goes with with solution.
A: Hello. Since you have posted multiple questions and not specified which question needs to be solved,…
Q: A independent sample t-test with a df-15 resulte (Be sure to round answer to the second decimal pl
A: Given information: t=2.95 df=15
Q: The average family size was reported at 3.18. A random sample of families in a particular community…
A: Consider that μ defines the population mean family size. Here, it is needed to check whether the…
Q: Construct all random samples consisting two observations from the given data. You are asked to guess…
A:
Q: A t-test would be appropriate for which sample size? A. 50 B. 15 C. 1,000 D. 0
A: The t-test is used when the sample size is small and when the population standard deviation is not…
Q: A rancher's herd of 250 sheep grazes over a 40-acre pasture. He would like to find out how many…
A: Given that : A rancher's herd of 250 sheep grazes over a 40-acre pasture.
Q: X1,...,Xp~EXP(0) Ho:0 = 0, VS Ha : 0 # 0, Determine GLRT size a (Note: use the sample approach big)
A:
Q: More Heights The population of heights of adult males is normally distributed. If we obtain a…
A: The heights of adult males are normally distributed and voluntary response sample of 5,000 heights…
Q: pediatrician has three patients with measles and they are ages 1, 3, and 11. Assume that samples of…
A: Given: The population consists of 1, 3, and 11. The possible samples of size n=2 that can be drawn…
Q: Three randomly selected children are surveyed. The ages of the children are 2, 7, and 12. Assume…
A: a. Given population observations are 2, 7, 12. The even numbers are 2, 12. The proportion of even…
Q: A pediatrician has three patients with measles and they are ages 4, 6, and 7. Assume that samples of…
A: For the given data Find all the required blanks
Q: (a) Find the standard error of the mean for each sampling situation (assuming a normal population).…
A: In the question, We'll find the value of standard error of the mean for some given values of sigma…
Q: (a) Find the standard error of the mean for each sampling situation (assuming a normal population).…
A: Given that Data for calculation of Standard error of the mean. We know that Standard error (SE) =…
Q: Find the test statistic to for a sample with n=12, x=25.2, s=2.2, and α = 0.01 if Ho: μ=24. Round…
A:
Q: . H0:M = 2 HA :M #2 US ts =l.53 (s =1.53 For a sample size n= 10 7 De termine the p- value
A: Given Data: n=10 t=1.53 its a two tailed test degree of freedom=n-1=9
Q: The data in the table represent a possible starting lineup for a basketball team. Use the data to…
A: Given, The data in the table represent a possible starting lineup for a basket team. Assume that…
Q: The number of successes and the sample size are given for a simple random sample from a population.…
A:
Q: (a) Find the standard error of the mean for each sampling situation (Round your answers to 2 decimal…
A: Given : From image given in a question a. σ=16, n=16 b. σ=16, n=64 c. σ=16, n=256
Q: Find the mean of each sample. Round each answer to two decimal places. Sample A (in cubic…
A:
Q: H :p=0.42 H:p 0.42 a sample size = 150 sample proportion =0.45 a=0.05
A: Given : Sample size (n) = 150Sample proportion (p^) = 0.45α = 0.05
Q: Suppose 65% of all college students find watching TV a waste of time. The population proportion is…
A: Consider that p is proportion of all college students find watching TV a waste of time.
Q: (a) Find the standard error of the mean for each sampling situation (assuming a normal population).…
A: To formula to find Standard error is as follows; The standard error of the mean is usually estimated…
Q: A random sample of patients are selected and their blood pressures (high, low, or normal) and…
A: Probability is about determining the chance of occurrence of any event.
Q: A population consisting of 1,2,3,4, and 5.Suppose samples of size 2 are drawn from this population.…
A: As per bartleby policy i have answered first two questions. please post the remaining questions…
Q: 3. Construct all random samples consisting two observations from the given data. You are asked to…
A:
Q: ProblemOFnd 95% confelance Pnterval for M and az * itis Known that n=17 is the Size af the random…
A: Given that: X̄= 10 n=sample size= 17 Sample variance= 9 s=sample standard deviation=√9=3 Confidence…
Q: Time left The appropriate Interval width for a random sample of 100 observations that fall between…
A: It is an important part of statistics. It is widely used.
Q: (a) Find the standard error of the mean for each sampling situation (assuming a normal population).…
A:
Q: (a) Known Information: Za/2 ; E = (b) Desired Sample Size
A: Joshua wants to replicate a study where the lowest observed value is 12.4 while the highest is 12.8.…
Q: (a) Find the standard error of the mean for each sampling situation (assuming a normal population).…
A: We need to find out Standard Error 1) σ=30 , n=4 Standard Error = σn Standard Error = 30/√2 = 15…
Q: Which of the following is the value of ?0.05 with a sample size of 10? a. 1.812 b. 1.900 c.…
A: Given that, alpha=0.05 Sample size n=10
Q: Using slovin's formula Compute the sample size. A. N = 1000 and e = 0.05. B. N = 5000 and e = 0.05.…
A: Given : A. N = 1000 and e = 0.05 B. N = 5000 and e = 0.05 C. N = 10000 and e = 0.05
Q: e) Find the standard error of the mean for each sampling situation (assuming a normal population).…
A: Find standard error for following
Q: Determine u, and o, from the given parameters of the population and the sample size. Round the…
A: Points on sampling distribution of the sample mean: If the true population distribution of a random…
Q: c. The test-statistic for this data is x . (Please show your answer to three decimal %3D places.) d.…
A: GIVEN: Observed frequency Oi Single Family Couple Total Dog 83 93 94 270 Cat 118 86 65 269…
Q: (a) Find the standard error of the mean for each sampling situation (assuming a normal population).…
A: The standard error for the sample mean is given by:
Q: 10. Given u= 15, o = 5, and n = 50. This is an example of the sampling distribution of the sample…
A:
Q: There are approximately 2.1 million community college students in California. A researcher wants to…
A: d) simple random sampling.
Q: Let X-K NU. 16). How much should the sample size be for testing He= 24 vs. He=25 at a0.025 and…
A: Introduction :- For given hypothesis testing we have to find sample size for which, Size of test =…
Q: Weatherwise is a magazine published in association with the American Meteorological Society. In the…
A: The Null hypothesis H0: μ = 16.4. Alternative hypothesis Ha: μ <16.4 Here, α =0.01 Since…
Q: (a) Determine the sampling distribution of the sample mean X. (b) Find the mean E(X) of the sampling…
A: Here use basic concept of sampling distribution of sample mean
Q: Construct all random samples consisting two observations from the given data. You are asked to guess…
A: We have to select all possible random sample of size 2 from population size of 6.
Q: A developer wants to know if the houses in two different neighborhoods were built at roughly the…
A: Given data, For Neighborhood 1: 58,60,56,45,61,50 For Neighborhood 2: 42,56,54,32,48,50
Q: dvocacy organization surveys 966 citizens of country A and 186 of them reported being born in…
A: We have to find difference in sample proportion.
Q: (a) Find the standard error of the mean for each sampling situation (assuming a normal population).…
A:


Step by step
Solved in 2 steps


- What does the y -intercept on the graph of a logistic equation correspond to for a population modeled by that equation?The operator of a pumping station has observed that demand for water during early afternoon hours has an approximately exponential distribution with mean 100 cfs (cubic feet per second).a) Find the probability that the demand will exceed 200 cfs during the early afternoon on arandomly selected day.b) What water-pumping capacity should the station maintain during early afternoons sothat the probability that demand will exceed capacity on a randomly selected day isonly .01?A manufacturer claims that the tensile strength of a certain composite (in MPa) has the lognormal distribution with μ = 5 and σ = 0.5. Let X be the strength of a randomly sampled specimen of this composite. a) If the claim is true, what is P(X < 20)? b) Based on the answer to part (a), if the claim is true, would a strength of 20 MPa be unusually small? c) If you observed a tensile strength of 20 MPa, would this be convincing evidence that the claim is false? Explain. d) If the claim is true, what is P(X < 130)? e) Based on the answer to part (d), if the claim is true, would a strength of 130 MPa be unusually small? f) If you observed a tensile strength of 130 MPa, would this be convincing evidence that the claim is false? Explain.
- The operator of a pumping station has observed that demand for waterduring early afternoon hours has an approximately exponential distribution with mean 1000cfs (cubic feet per second).a) Find the probability that the demand will exceed 700 cfs during the early afternoonon a randomly selected day.b) What water-pumping capacity should the station maintain during early afternoons sothat the probability that demand will be below the capacity on a randomly selectedday is 0.995?c) Of the three randomly selected afternoons, what is the probability that on at least twoafternoons the demand will exceed 700 cfs? 2. Let Y1 and Y2 be random variables with joint density functionf(y1, y2) = (6/7(y^2+y1y2/2) 0 < y1 < 1, 0 < y2 < 2,0, elsewherea) Find marginal density functions. Are Y1 and Y2 independent?b) Find P(0 < Y1 < 0.3, −2 < Y2 < 1).c) Find P(0.6 < Y1 < 1|0 < Y2 < 1). 3.The joint density function of Y1 and Y2 is given byf(y1, y2) = (y1 + y2), 0 <…Since the Cobot’s gripper is a critical component, a reliability of 99% is desired for that component. The failure time, in hours, of the cobot’s gripper follows a lognormal distribution with µt=10.52 and σt= 1.44. the gripper is considered a consumable item (i.e., if failed, the gripper is replaced, not repaired. a. What is the MTTF? b. At what number of hours of use should the gripper be replaced to meet the desired 99% reliability?The operator of a pumping station has observed that demand for water during early afternoon hours has an approximately exponential distribution with mean 1000 cfs (cubic feet per second). a)Of the three randomly selected afternoons, what is the probability that on at least two afternoons the demand will exceed 700 cfs?
- An assemb ly-line worker at Joseph Milner'sFabrication Shop inserts Pa rt A into Part B. A time study wasconducted and produced the fo llowing results in seconds: 8.4, 8.6,8.3, 8.5, 8.7, 8.5. What is the average cycle time?The operator of a pumping station has observed that demand for water during early afternoon hours has an approximately exponential distribution with mean 1000 cfs (cubic feet per second). b) What water-pumping capacity should the station maintain during early afternoons so that the probability that demand will be below the capacity on a randomly selected day is 0.995? c) Of the three randomly selected afternoons, what is the probability that on at least two afternoons the demand will exceed 700 cfs?A random sample of 25 tires gave the average life as 38000 km and S.D. as 5000 km. Can it be concluded that the sample is drawn from a population with a mean life of 40000 km?
- The article “Withdrawal Strength of Threaded Nails” (D. Rammer, S. Winistorfer, and D. Bender, Journal of Structural Engineering 2001:442–449) describes an experiment comparing the ultimate withdrawal strengths (in N/mm) for several types of nails. For an annularly threaded nail with shank diameter 3.76 mm driven into spruce-pine-fir lumber, the ultimate withdrawal strength was modeled as lognormal with μ = 3.82 and σ = 0.219. For a helically threaded nail under the same conditions, the strength was modeled as lognormal with μ = 3.47 and σ = 0.272. a) What is the mean withdrawal strength for annularly threaded nails? b) What is the mean withdrawal strength for helically threaded nails? c) For which type of nail is it more probable that the withdrawal strength will be greater than 50 N/mm? d) What is the probability that a helically threaded nail will have a greater withdrawal strength than the median for annularly threaded nails? e) An experiment is performed in which withdrawal…The positive random variable X is said to be a log-normal random variable with parameters μ and σ2 if log(X) is a normal random variable with mean μ and variance σ2. Use the normal moment generating function to find the mean and variance of a lognormal random variable. Hint: Let Y = log(X ) and find E[X ].Kaitlyn measures the upload speed in megabits per second of her home broadband internet connection during peak hours and off-peak hours. The results are provided in the accompanying table. Peak Off-Peak 5.83 5.14 6.05 6.80 7.14 6.98 3.54 5.77 5.45 7.27 5.90 6.62 5.81 6.19 4.82 6.08 6.37 6.59 4.65 5.58 5.30 7.41 6.48 6.26 5.96 6.37 5.79 6.31 6.84 6.55 5.06 4.95 5.61 7.03 6.45 6.77 Examine the results of Kaitlyn's test to determine the statements that compare the medians and interquartile ranges of the data sets to each other in terms of this situation. Select the two correct answers. The median upload speed during peak hours is 5.905 megabits per second, which is less than the median upload speed during off-peak hours, 7.005 megabits per second. The upload speeds during peak hours are slower on average compared to off-peak times. The median upload speed during peak hours is 6.37 megabits per second, which is greater than the median upload speed during…

