A simple random sample from a population with a normal distribution of 97 body temperatures has x=98.50°F and s=0.61°F. Construct a 98% confidence interval estimate o the standard deviation of body temperature of all healthy humans. 12 Click the icon to view the table of Chi-Square critical values. 7°F
A simple random sample from a population with a normal distribution of 97 body temperatures has x=98.50°F and s=0.61°F. Construct a 98% confidence interval estimate o the standard deviation of body temperature of all healthy humans. 12 Click the icon to view the table of Chi-Square critical values. 7°F

A First Course in Probability (10th Edition)
10th Edition
ISBN:9780134753119
Author:Sheldon Ross
Publisher:Sheldon Ross
Chapter1: Combinatorial Analysis
Section: Chapter Questions
Problem 1.1P: a. How many different 7-place license plates are possible if the first 2 places are for letters and...

Related questions
Question
A simple random sample from a population with a
Transcribed Image Text:34.
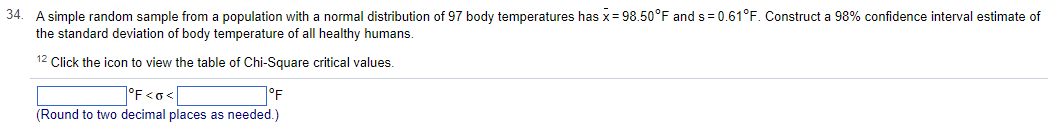
A simple random sample from a population with a normal distribution of 97 body temperatures has x = 98.50°F and s= 0.61°F. Construct a 98% confidence interval estimate of
the standard deviation of body temperature of all healthy humans.
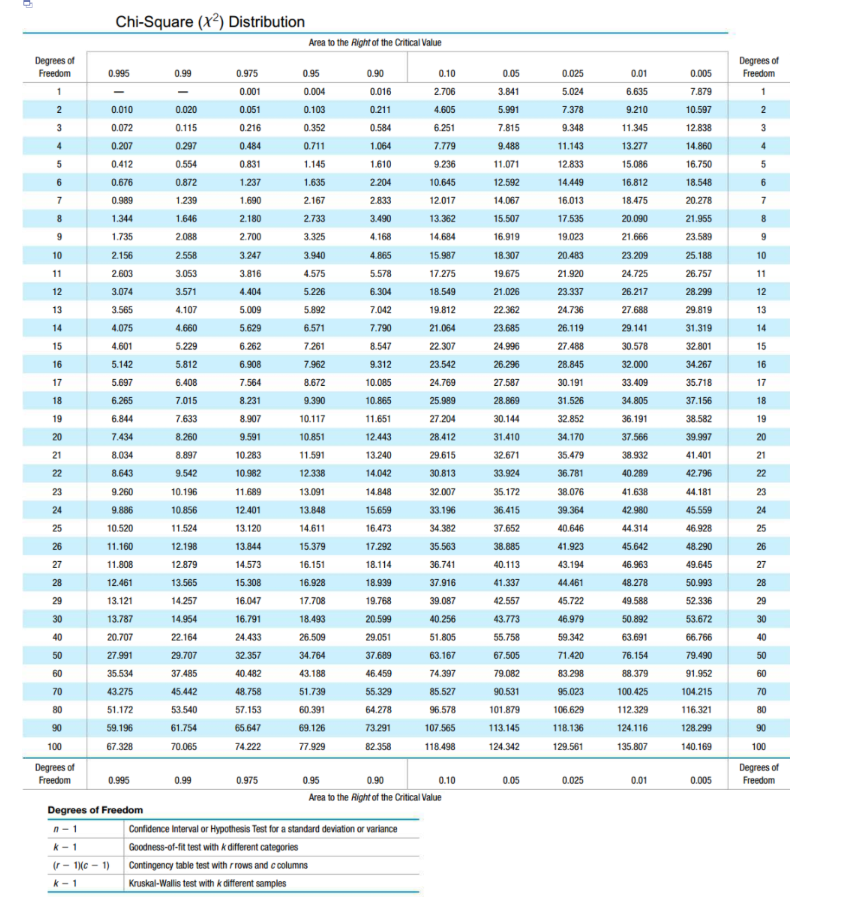
12 Click the icon to view the table of Chi-Square critical values.
°F <o<
°F
(Round to two decimal places as needed.)
Transcribed Image Text:6
Degrees of
Freedom
1
2
3
4
5
6
7
8
9
10
11
12
13
14
15
16
67
17
18
19
20
21
22
23
24
25
26
27
28
29
30
40
50
60
70
80
90
100
Degrees of
Freedom
Chi-Square (X2) Distribution
0.995
0.010
0.072
0.207
0.412
0.676
0.989
1.344
1.735
2.156
2.603
3.074
3.565
4.075
4.601
5.142
5.697
6.265
6.844
7.434
8.034
8.643
9.260
9.886
10.520
11.160
11.808
12.461
13.121
13.787
20.707
27.991
35.534
43.275
51.172
59.196
67.328
0.995
(r- 1)(c-1)
k-1
Degrees of Freedom
n-1
k-1
0.99
0.020
0.115
0.297
0.554
0.872
1.239
1.646
2.088
2.558
3.053
3.571
4.107
4.660
5.229
5.812
6.408
7.015
7.633
8.260
8.897
9.542
10.196
10.856
11.524
12.198
12.879
13.565
14.257
14.954
22.164
29.707
37.485
45.442
53.540
61.754
70.065
0.99
0.975
0.001
0.051
0.216
0.484
0.831
1.237
1.690
2.180
2.700
3.247
3.816
4.404
5.009
5.629
6.262
6.908
7.564
8.231
8.907
9.591
10.283
10.982
11.689
12.401
13.120
13.844
14.573
15.308
16.047
16.791
24.433
32.357
40.482
48.758
57.153
65.647
74.222
0.975
Area to the Right of the Critical Value
0.95
0.004
0.103
0.352
0.711
1.145
1.635
2.167
2.733
3.325
3.940
4.575
5.226
5.892
6.571
7.261
7.962
8.672
9.390
10.117
10.851
11.591
12.338
13.091
13.848
14.611
15.379
16.151
16.928
17.708
18.493
26.509
34.764
43.188
51.739
60.391
69.126
77.929
0.90
0.016
0.211
0.584
1.064
1.610
2.204
2.833
3.490
4.168
4.865
5.578
Contingency table test with rrows and c columns
Kruskal-Wallis test with k different samples
6.304
7.042
7.790
8.547
9.312
10.085
10.865
11.651
12.443
13.240
14.042
14.848
15.659
16.473
17.292
18.114
18.939
19.768
20.599
29.051
37.689
46.459
55.329
64.278
73.291
82.358
Confidence Interval or Hypothesis Test for a standard deviation or variance
Goodness-of-fit test with different categories
0.10
2.706
4.605
6.251
7.779
9.236
10.645
12.017
13.362
14.684
15.987
17.275
18.549
19.812
21.064
22.307
23.542
24.769
25.989
27.204
28.412
29.615
30.813
32.007
33.196
34.382
35.563
36.741
37.916
39.087
40.256
0.95
0.90
Area to the Right of the Critical Value
51.805
63.167
74.397
85.527
96.578
107.565
118.498
0.10
0.05
3.841
5.991
7.815
9.488
11.071
12.592
14.067
15.507
16.919
18.307
19.675
21.026
22.362
23.685
24.996
26.296
27.587
28.869
30.144
31.410
32.671
33.924
35.172
36.415
37.652
38.885
40.113
41.337
42.557
43.773
55.758
67.505
79.082
90.531
101.879
113.145
124.342
0.05
0.025
5.024
7.378
9.348
11.143
12.833
14.449
16.013
17.535
19.023
20.483
21.920
23.337
24.736
26.119
27.488
28.845
30.191
31.526
32.852
34.170
35.479
36.781
38.076
39.364
40.646
41.923
43.194
44.461
45.722
46.979
59.342
71.420
83.298
95.023
106.629
118.136
129.561
0.025
0.01
6.635
9.210
11.345
13.277
15.086
16.812
18.475
20.090
21.666
23.209
24.725
26.217
27.688
29.141
30.578
32.000
33.409
34.805
36.191
37.566
38.932
40.289
41.638
42.980
44.314
45.642
46.963
48.278
49.588
50.892
63.691
76.154
88.379
100.425
112.329
124.116
135.807
0.01
0.005
7.879
10.597
12.838
14.860
16.750
18.548
20.278
21.955
23.589
25.188
26.757
28.299
29.819
31.319
32.801
34.267
35.718
37.156
38.582
39.997
41.401
42.796
44.181
45.559
46.928
48.290
49.645
50.993
52.336
53.672
66.766
79.490
91.952
104.215
116.321
128.299
140.169
0.005
Degrees of
Freedom
1
2
3
4
5
6
7
8
9
10
11
12
13
14
15
16
1 2 2 2 2 2 2 2 2 2 2 8 2888
17
18
19
20
21
22
23
24
25
26
27
28
29
30
40
50
60
70
80
90
100
Degrees of
Freedom
Expert Solution
This question has been solved!
Explore an expertly crafted, step-by-step solution for a thorough understanding of key concepts.

Step by step
Solved in 3 steps with 2 images

Recommended textbooks for you
A First Course in Probability (10th Edition)
Probability
ISBN:
9780134753119
Author:
Sheldon Ross
Publisher:
PEARSON

A First Course in Probability (10th Edition)
Probability
ISBN:
9780134753119
Author:
Sheldon Ross
Publisher:
PEARSON