A standardized exam's scores are normally distributed. In a recent year, the mean test score was 21.1 and the standard deviation was 5.6 . The test scores of four students selected at random are 14 , 22 , 7 , and 37 . Find the z-scores that correspond to each value and determine whether any of the values are unusual. The z-score for 14 is nothing . (Round to two decimal places as needed.) The z-score for 22 is nothing . (Round to two decimal places as needed.) The z-score for 7 is nothing . (Round to two decimal places as needed.) The z-score for 37 is nothing . (Round to two decimal places as needed.) Which values, if any, are unusual? Select the correct choice below and, if necessary, fill in the answer box within your choice. A. The unusual value(s) is/are nothing . (Use a comma to separate answers as needed.) B. None of the values are unusual.
A standardized exam's scores are normally distributed. In a recent year, the mean test score was 21.1 and the standard deviation was 5.6 . The test scores of four students selected at random are 14 , 22 , 7 , and 37 . Find the z-scores that correspond to each value and determine whether any of the values are unusual. The z-score for 14 is nothing . (Round to two decimal places as needed.) The z-score for 22 is nothing . (Round to two decimal places as needed.) The z-score for 7 is nothing . (Round to two decimal places as needed.) The z-score for 37 is nothing . (Round to two decimal places as needed.) Which values, if any, are unusual? Select the correct choice below and, if necessary, fill in the answer box within your choice. A. The unusual value(s) is/are nothing . (Use a comma to separate answers as needed.) B. None of the values are unusual.

Glencoe Algebra 1, Student Edition, 9780079039897, 0079039898, 2018
18th Edition
ISBN:9780079039897
Author:Carter
Publisher:Carter
Chapter10: Statistics
Section10.5: Comparing Sets Of Data
Problem 14PPS

Related questions

Question
A standardized exam's scores are
21.1
and the standard deviation was
5.6
.
The test scores of four students selected at random are
14
,
22
,
7
,
and
37
.
Find the z-scores that correspond to each value and determine whether any of the values are unusual.The z-score for
14
is
nothing
.
(Round to two decimal places as needed.)
The z-score for
22
is
nothing
.
(Round to two decimal places as needed.)
The z-score for
7
is
nothing
.
(Round to two decimal places as needed.)
The z-score for
37
is
nothing
.
(Round to two decimal places as needed.)
Which values, if any, are unusual? Select the correct choice below and, if necessary, fill in the answer box within your choice.
A.
The unusual value(s) is/are
nothing
.
(Use a comma to separate answers as needed.)
B.
None of the values are unusual.
The weights of bags of baby carrots are normally distributed, with a mean of 34 ounces and a standard deviation of
ounces without needing to be repackaged.
0.36 ounce. Bags in the upper 4.5% are too heavy and must be repackaged. What is the most a bag of baby carrots can weigh and not need to be repackaged?
A bag of baby carrots can weigh at most
nothing
(Round to two decimal places as needed.)
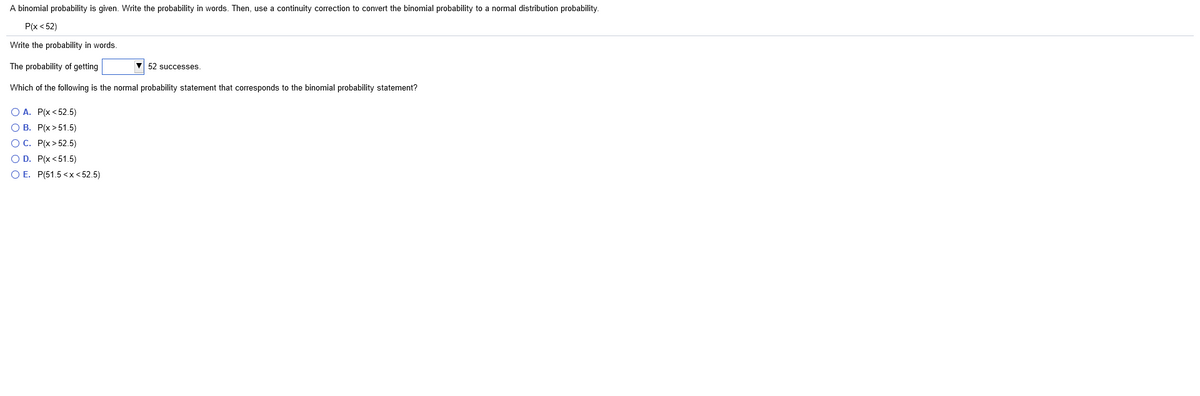
Transcribed Image Text:A binomial probability is given. Write the probability in words. Then, use a continuity correction to convert the binomial probability to a normal distribution probability.
Р/x < 52)
Write the probability in words.
The probability of getting
V 52 successes.
Which of the following is the normal probability statement that corresponds to the binomial probability statement?
O A. P(x < 52.5)
О В. Р(х >51.5)
ОС. Р(x > 52.5)
O D. P(x <51.5)
O E. P(51.5 <x < 52.5)
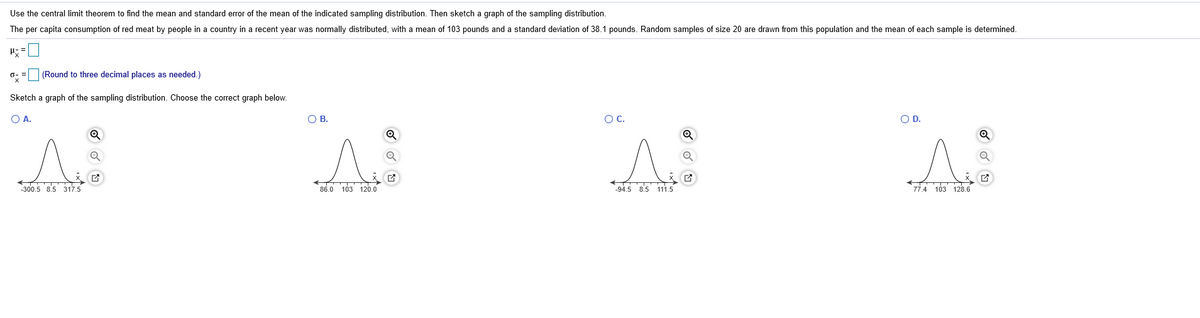
Transcribed Image Text:Use the central limit theorem to find the mean and standard error of the mean of the indicated sampling distribution. Then sketch a graph of the sampling distribution.
The per capita consumption of red meat by people in a country in a recent year was normally distributed, with a mean of 103 pounds and a standard deviation of 38.1 pounds. Random samples of size 20 are drawn from this population and the mean of each sample is determined.
(Round to three decimal places as needed.)
Sketch a graph of the sampling distribution. Choose the correct graph below.
O A.
O B.
OC.
OD.
-300.5 8.5 317.5
86.0 103 120.0
94.5 8.5 111,5
77.4 103 128.6
Expert Solution
This question has been solved!
Explore an expertly crafted, step-by-step solution for a thorough understanding of key concepts.

This is a popular solution!

Trending now
This is a popular solution!

Step by step
Solved in 4 steps

Knowledge Booster


Learn more about
Need a deep-dive on the concept behind this application? Look no further. Learn more about this topic, probability and related others by exploring similar questions and additional content below.Recommended textbooks for you
Glencoe Algebra 1, Student Edition, 9780079039897…
Algebra
ISBN:
9780079039897
Author:
Carter
Publisher:
McGraw Hill
Glencoe Algebra 1, Student Edition, 9780079039897…
Algebra
ISBN:
9780079039897
Author:
Carter
Publisher:
McGraw Hill