a) State the sinusoidal regression function that represents the graph above in the Form = a sin(bx - 2.244) + d where y represents the number of gerbils and x the number of days since the clerk started collecting the data. If necessary, round values to the nearest hundredth. b) The pet store purchases more gerbils when number of gerbils falls to 27 gerbils. Calculate the fewest number of days after the clerk started collecting the data -hould net store nurchase more gerbils, to the nearest hundredth of day.
a) State the sinusoidal regression function that represents the graph above in the Form = a sin(bx - 2.244) + d where y represents the number of gerbils and x the number of days since the clerk started collecting the data. If necessary, round values to the nearest hundredth. b) The pet store purchases more gerbils when number of gerbils falls to 27 gerbils. Calculate the fewest number of days after the clerk started collecting the data -hould net store nurchase more gerbils, to the nearest hundredth of day.

Algebra & Trigonometry with Analytic Geometry
13th Edition
ISBN:9781133382119
Author:Swokowski
Publisher:Swokowski
Chapter11: Topics From Analytic Geometry
Section11.3: Hyperbolas
Problem 42E

Related questions
Topic Video
Question
100%
Transcribed Image Text:ays
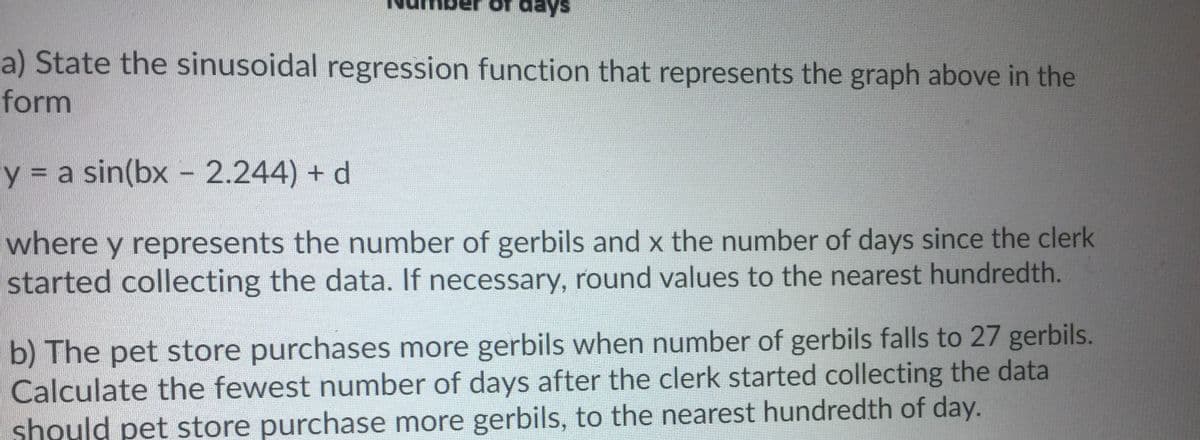
a) State the sinusoidal regression function that represents the graph above in the
form
y = a sin(bx - 2.244) + d
where y represents the number of gerbils and x the number of days since the clerk
started collecting the data. If necessary, round values to the nearest hundredth.
b) The pet store purchases more gerbils when number of gerbils falls to 27 gerbils.
Calculate the fewest number of days after the clerk started collecting the data
should pet store purchase more gerbils, to the nearest hundredth of day.
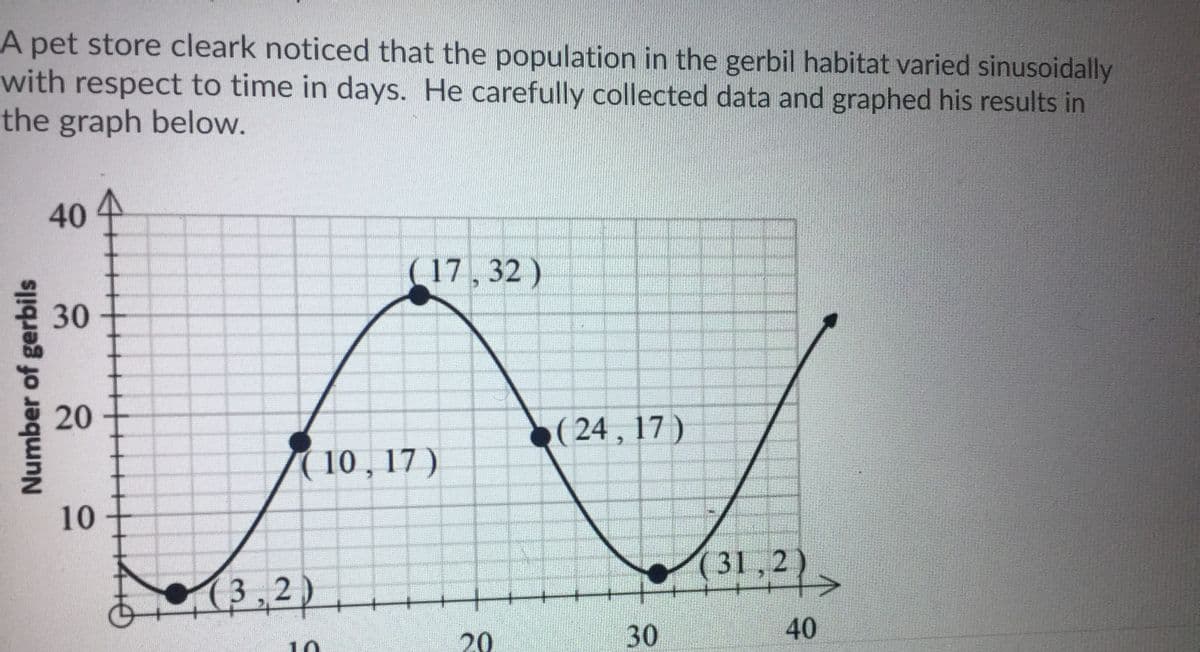
Transcribed Image Text:A pet store cleark noticed that the population in the gerbil habitat varied sinusoidally
with respect to time in days. He carefully collected data and graphed his results in
the graph below.
40
4
(17,32)
30
20
( 24 , 17 )
(10 , 17 )
10
(3,2)
(31,2)
21>
10
40
30
20
Number of gerbils
Expert Solution
This question has been solved!
Explore an expertly crafted, step-by-step solution for a thorough understanding of key concepts.

This is a popular solution!

Trending now
This is a popular solution!

Step by step
Solved in 2 steps with 2 images

Knowledge Booster


Learn more about
Need a deep-dive on the concept behind this application? Look no further. Learn more about this topic, calculus and related others by exploring similar questions and additional content below.Recommended textbooks for you
Algebra & Trigonometry with Analytic Geometry
Algebra
ISBN:
9781133382119
Author:
Swokowski
Publisher:
Cengage
Algebra & Trigonometry with Analytic Geometry
Algebra
ISBN:
9781133382119
Author:
Swokowski
Publisher:
Cengage