Critical Values of the t-Distribution (page 1) a v 0.40 0.30 0.20 0.15 0.10 0.05 0.025 1 0.325 0.727 1.376 1.963 3.078 6.314 12.706 2 0.289 0.617 1.061 1.386 1.886 2.920 4.303 3 0.277 0.584 0.978 1.250 1.638 2.353 3.182 4 0.271 0.569 0.941 1.190 1.533 2.132 2.776 5 0.267 0.559 0.920 1.156 1.476 2.015 2.571 6 0.265 0.553 0.906 1.134 1.440 1.943 2.447 7 0.263 0.549 0.896 1.119 1.415 1.895 2.365 8 0.262 0.546 0.889 1.108 1.397 1.860 2.306 9 0.261 0.543 0.883 1.100 1.383 1.833 2.262 10 0.260 0.542 0.879 1.093 1.372 1.812 2.228 11 0.260 0.540 0.876 1.088 1.363 1.796 2.201 40 120 2222222222234828 0.259 0.539 0.873 1.083 1.356 1.782 2.179 13 0.259 0.538 0.870 1.079 1.350 1.771 2.160 0.258 0.537 0.868 1.076 1.345 1.761 2.145 0.258 0.536 0.866 1.074 1.341 1.753 2.131 16 0.258 0.535 0.865 1.071 1.337 1.746 2.120 0.257 0.534 0.863 1.069 1.333 1.740 2.110 0.257 0.534 0.862 1.067 1.330 1.734 2.101 0.257 0.533 0.861 1.066 1.328 1.729 2.093 20 0.257 0.533 0.860 1.064 1.325 1.725 2.086 21 0.257 0.532 0.859 1.063 1.323 1.721 2.080 0.256 0.532 0.858 1.061 1.321 1.717 2.074 0.256 0.532 0.858 1.060 1.319 1.714 2.069 0.256 0.531 0.857 1.059 1.318 1.711 2.064 25 0.256 0.531 0.856 1.058 1.316 1.708 2.060 26 0.256 0.531 0.856 1.058 1.315 1.706 2.056 27 0.256 0.531 0.855 1.057 1.314 1.703 2.052 0.256 0.530 0.855 1.056 1.313 1.701 2.048 29 0.256 0.530 0.854 1.055 1.311 1.699 2.045 30 0.256 0.530 0.854 1.055 1.310 1.697 2.042 0.255 0.529 0.851 1.050 1.303 1.684 2.021 60 0.254 0.527 0.848 1.045 1.296 1.671 2.000 0.254 0.526 0.845 1.041 1.289 1.658 1.980 0.253 0.524 0.842 1.036 1.282 1.645 1.960 e v 0.40 0.30 0.20 0.15 0.10 0.05 0.025 ¡A a Dr > > > с - 2 < > C + Critical Values of the t-Distribution (page 2) a 0.02 0.015 0.01 0.0075 0.005 0.0025 0.0005 1 15.894 21.205 31.821 42.433 63.656 127.321 636.578 2 4.849 5.643 6.965 8.073 9.925 14.089 31.600 3 3.482 3.896 4.541 5.047 5.841 7.453 12.924 4 2.999 3.298 3.747 4.088 4.604 5.598 8.610 5 2.757 3.003 3.365 3.634 4.032 4.773 6.869 6 2.612 2.829 3.143 3.372 3.707 4.317 5.959 7 2.517 2.715 2.998 3.203 3.499 4.029 5.408 8 2.449 2.634 2.896 3.085 3.355 3.833 5.041 2.398 2.574 2.821 2.998 3.250 3.690 4.781 2.359 2.527 2.764 2.932 3.169 3.581 4.587 2.328 2.491 2.718 2.879 3.106 3.497 4.437 2.303 2.461 2.681 2.836 3.055 3.428 4.318 2.282 2.436 2.650 2.801 3.012 3.372 4.221 2.264 2.415 2.624 2.771 2.977 3.326 4.140 2.249 2.397 2.602 2.746 2.947 3.286 4.073 2.235 2.382 2.583 2.724 2.921 3.252 4.015 2.224 2.368 2.567 2.706 2.898 3.222 3.965 2.214 2.356 2.552 2.689 2.878 3.197 3.922 120 2 2 2 2 9 8 285 2.205 2.346 2.539 2.674 2.861 3.174 3.883 2.197 2.336 2.528 2.661 2.845 3.153 3.850 2.189 2.328 2.518 2.649 2.831 3.135 3.819 2.183 2.320 2.508 2.639 2.819 3.119 3.792 2.177 2.313 2.500 2.629 2.807 3.104 3.768 24 2.172 2.307 2.492 2.620 2.797 3.091 3.745 2.167 2.301 2.485 2.612 2.787 3.078 3.725 2.162 2.296 2.479 2.605 2.779 3.067 3.707 2.158 2.291 2.473 2.598 2.771 3.057 3.689 28 2.154 2.286 2.467 2.592 2.763 3.047 3.674 29 2.150 2.282 2.462 2.586 2.756 3.038 3.660 30 2.147 2.278 2.457 2.581 2.750 3.030 3.646 40 2.123 2.250 2.423 2.542 2.704 2.971 3.551 60 2.099 2.223 2.390 2.504 2.660 2.915 3.460 2.076 2.196 2.358 2.468 2.617 2.860 3.373 2.054 2.170 2.326 2.432 2.576 2.807 3.290 0.02 0.015 0.01 0.0075 0.005 0.0025 0.0005 a A study was made on the amount of converted sugar in a certain process at various temperatures. The data were coded and recorded in the accompanying table. Use this information to answer parts a through c. Click here to view the table of temperatures versus converted sugars. Click here to view page 1 of the critical values of the t-distribution. Click here to view page 2 of the critical values of the t-distribution. a) Evaluate s². $² = (Round to two decimal places as needed.) b) Construct a 95% confidence interval for Bo
Critical Values of the t-Distribution (page 1) a v 0.40 0.30 0.20 0.15 0.10 0.05 0.025 1 0.325 0.727 1.376 1.963 3.078 6.314 12.706 2 0.289 0.617 1.061 1.386 1.886 2.920 4.303 3 0.277 0.584 0.978 1.250 1.638 2.353 3.182 4 0.271 0.569 0.941 1.190 1.533 2.132 2.776 5 0.267 0.559 0.920 1.156 1.476 2.015 2.571 6 0.265 0.553 0.906 1.134 1.440 1.943 2.447 7 0.263 0.549 0.896 1.119 1.415 1.895 2.365 8 0.262 0.546 0.889 1.108 1.397 1.860 2.306 9 0.261 0.543 0.883 1.100 1.383 1.833 2.262 10 0.260 0.542 0.879 1.093 1.372 1.812 2.228 11 0.260 0.540 0.876 1.088 1.363 1.796 2.201 40 120 2222222222234828 0.259 0.539 0.873 1.083 1.356 1.782 2.179 13 0.259 0.538 0.870 1.079 1.350 1.771 2.160 0.258 0.537 0.868 1.076 1.345 1.761 2.145 0.258 0.536 0.866 1.074 1.341 1.753 2.131 16 0.258 0.535 0.865 1.071 1.337 1.746 2.120 0.257 0.534 0.863 1.069 1.333 1.740 2.110 0.257 0.534 0.862 1.067 1.330 1.734 2.101 0.257 0.533 0.861 1.066 1.328 1.729 2.093 20 0.257 0.533 0.860 1.064 1.325 1.725 2.086 21 0.257 0.532 0.859 1.063 1.323 1.721 2.080 0.256 0.532 0.858 1.061 1.321 1.717 2.074 0.256 0.532 0.858 1.060 1.319 1.714 2.069 0.256 0.531 0.857 1.059 1.318 1.711 2.064 25 0.256 0.531 0.856 1.058 1.316 1.708 2.060 26 0.256 0.531 0.856 1.058 1.315 1.706 2.056 27 0.256 0.531 0.855 1.057 1.314 1.703 2.052 0.256 0.530 0.855 1.056 1.313 1.701 2.048 29 0.256 0.530 0.854 1.055 1.311 1.699 2.045 30 0.256 0.530 0.854 1.055 1.310 1.697 2.042 0.255 0.529 0.851 1.050 1.303 1.684 2.021 60 0.254 0.527 0.848 1.045 1.296 1.671 2.000 0.254 0.526 0.845 1.041 1.289 1.658 1.980 0.253 0.524 0.842 1.036 1.282 1.645 1.960 e v 0.40 0.30 0.20 0.15 0.10 0.05 0.025 ¡A a Dr > > > с - 2 < > C + Critical Values of the t-Distribution (page 2) a 0.02 0.015 0.01 0.0075 0.005 0.0025 0.0005 1 15.894 21.205 31.821 42.433 63.656 127.321 636.578 2 4.849 5.643 6.965 8.073 9.925 14.089 31.600 3 3.482 3.896 4.541 5.047 5.841 7.453 12.924 4 2.999 3.298 3.747 4.088 4.604 5.598 8.610 5 2.757 3.003 3.365 3.634 4.032 4.773 6.869 6 2.612 2.829 3.143 3.372 3.707 4.317 5.959 7 2.517 2.715 2.998 3.203 3.499 4.029 5.408 8 2.449 2.634 2.896 3.085 3.355 3.833 5.041 2.398 2.574 2.821 2.998 3.250 3.690 4.781 2.359 2.527 2.764 2.932 3.169 3.581 4.587 2.328 2.491 2.718 2.879 3.106 3.497 4.437 2.303 2.461 2.681 2.836 3.055 3.428 4.318 2.282 2.436 2.650 2.801 3.012 3.372 4.221 2.264 2.415 2.624 2.771 2.977 3.326 4.140 2.249 2.397 2.602 2.746 2.947 3.286 4.073 2.235 2.382 2.583 2.724 2.921 3.252 4.015 2.224 2.368 2.567 2.706 2.898 3.222 3.965 2.214 2.356 2.552 2.689 2.878 3.197 3.922 120 2 2 2 2 9 8 285 2.205 2.346 2.539 2.674 2.861 3.174 3.883 2.197 2.336 2.528 2.661 2.845 3.153 3.850 2.189 2.328 2.518 2.649 2.831 3.135 3.819 2.183 2.320 2.508 2.639 2.819 3.119 3.792 2.177 2.313 2.500 2.629 2.807 3.104 3.768 24 2.172 2.307 2.492 2.620 2.797 3.091 3.745 2.167 2.301 2.485 2.612 2.787 3.078 3.725 2.162 2.296 2.479 2.605 2.779 3.067 3.707 2.158 2.291 2.473 2.598 2.771 3.057 3.689 28 2.154 2.286 2.467 2.592 2.763 3.047 3.674 29 2.150 2.282 2.462 2.586 2.756 3.038 3.660 30 2.147 2.278 2.457 2.581 2.750 3.030 3.646 40 2.123 2.250 2.423 2.542 2.704 2.971 3.551 60 2.099 2.223 2.390 2.504 2.660 2.915 3.460 2.076 2.196 2.358 2.468 2.617 2.860 3.373 2.054 2.170 2.326 2.432 2.576 2.807 3.290 0.02 0.015 0.01 0.0075 0.005 0.0025 0.0005 a A study was made on the amount of converted sugar in a certain process at various temperatures. The data were coded and recorded in the accompanying table. Use this information to answer parts a through c. Click here to view the table of temperatures versus converted sugars. Click here to view page 1 of the critical values of the t-distribution. Click here to view page 2 of the critical values of the t-distribution. a) Evaluate s². $² = (Round to two decimal places as needed.) b) Construct a 95% confidence interval for Bo

A First Course in Probability (10th Edition)
10th Edition
ISBN:9780134753119
Author:Sheldon Ross
Publisher:Sheldon Ross
Chapter1: Combinatorial Analysis
Section: Chapter Questions
Problem 1.1P: a. How many different 7-place license plates are possible if the first 2 places are for letters and...

Related questions
Question
Please solve the attached parts a,b, and c and provide final answers rounded as needed in each part
Table of temperatures versus sugar:
Linear regression equation: ŷ = 6.3318 + 1.8818x
| Temperature, x | Converted Sugar, y |
| 1 | 8.2 |
| 1.1 | 7.9 |
| 1.2 | 8.7 |
| 1.3 | 9.7 |
| 1.4 | 9.3 |
| 1.5 | 8.6 |
| 1.6 | 8.5 |
| 1.7 | 10.5 |
| 1.8 | 9.2 |
| 1.9 | 9.5 |
| 2 | 10.6 |
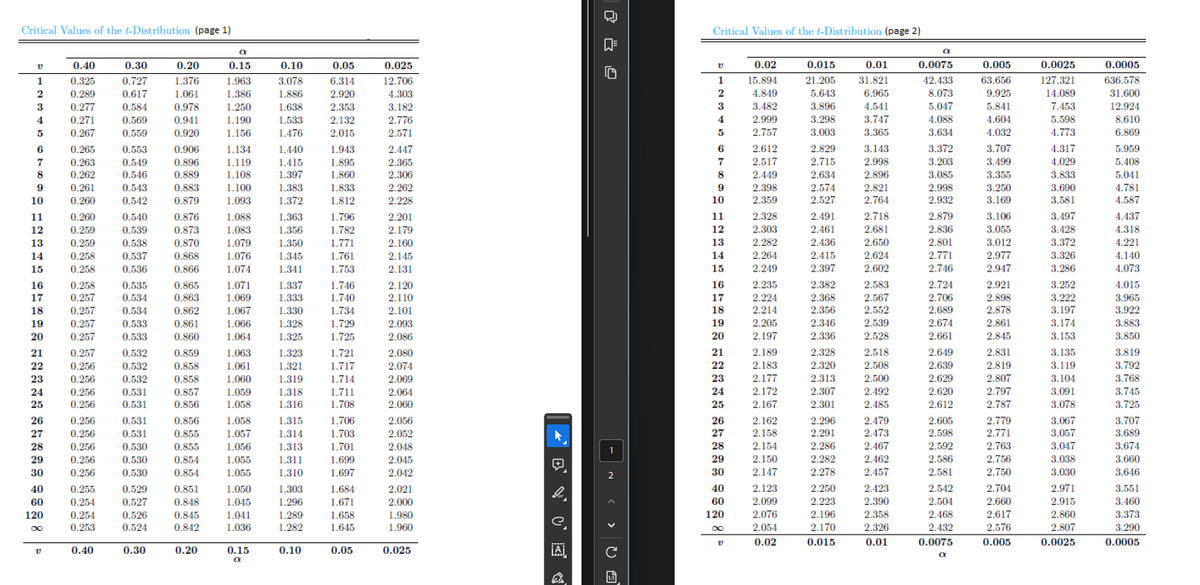
Transcribed Image Text:Critical Values of the t-Distribution (page 1)
a
v
0.40
0.30
0.20
0.15
0.10
0.05
0.025
1
0.325
0.727
1.376
1.963
3.078
6.314
12.706
2
0.289
0.617
1.061
1.386
1.886
2.920
4.303
3
0.277
0.584
0.978
1.250
1.638
2.353
3.182
4
0.271
0.569
0.941
1.190
1.533
2.132
2.776
5
0.267
0.559
0.920
1.156
1.476
2.015
2.571
6
0.265
0.553
0.906
1.134
1.440
1.943
2.447
7
0.263
0.549
0.896
1.119
1.415
1.895
2.365
8
0.262
0.546
0.889
1.108
1.397
1.860
2.306
9
0.261
0.543
0.883
1.100
1.383
1.833
2.262
10
0.260
0.542
0.879
1.093
1.372
1.812
2.228
11
0.260
0.540
0.876
1.088
1.363
1.796
2.201
40
120
2222222222234828
0.259
0.539
0.873
1.083
1.356
1.782
2.179
13
0.259
0.538
0.870
1.079
1.350
1.771
2.160
0.258
0.537
0.868
1.076
1.345
1.761
2.145
0.258
0.536
0.866
1.074
1.341
1.753
2.131
16
0.258
0.535
0.865
1.071
1.337
1.746
2.120
0.257
0.534
0.863
1.069
1.333
1.740
2.110
0.257
0.534
0.862
1.067
1.330
1.734
2.101
0.257
0.533
0.861
1.066
1.328
1.729
2.093
20
0.257
0.533
0.860
1.064
1.325
1.725
2.086
21
0.257
0.532
0.859
1.063
1.323
1.721
2.080
0.256
0.532
0.858
1.061
1.321
1.717
2.074
0.256
0.532
0.858
1.060
1.319
1.714
2.069
0.256
0.531
0.857
1.059
1.318
1.711
2.064
25
0.256
0.531
0.856
1.058
1.316
1.708
2.060
26
0.256
0.531
0.856
1.058
1.315
1.706
2.056
27
0.256
0.531
0.855
1.057
1.314
1.703
2.052
0.256
0.530
0.855
1.056
1.313
1.701
2.048
29
0.256
0.530
0.854
1.055
1.311
1.699
2.045
30
0.256
0.530
0.854
1.055
1.310
1.697
2.042
0.255
0.529
0.851
1.050
1.303
1.684
2.021
60
0.254
0.527
0.848
1.045
1.296
1.671
2.000
0.254
0.526
0.845
1.041
1.289
1.658
1.980
0.253
0.524
0.842
1.036
1.282
1.645
1.960
e
v
0.40
0.30
0.20
0.15
0.10
0.05
0.025
¡A
a
Dr
> > >
с
- 2 < > C +
Critical Values of the t-Distribution (page 2)
a
0.02
0.015
0.01
0.0075
0.005
0.0025
0.0005
1
15.894
21.205
31.821
42.433
63.656
127.321
636.578
2
4.849
5.643
6.965
8.073
9.925
14.089
31.600
3
3.482
3.896
4.541
5.047
5.841
7.453
12.924
4
2.999
3.298
3.747
4.088
4.604
5.598
8.610
5
2.757
3.003
3.365
3.634
4.032
4.773
6.869
6
2.612
2.829
3.143
3.372
3.707
4.317
5.959
7
2.517
2.715
2.998
3.203
3.499
4.029
5.408
8
2.449
2.634
2.896
3.085
3.355
3.833
5.041
2.398
2.574
2.821
2.998
3.250
3.690
4.781
2.359
2.527
2.764
2.932
3.169
3.581
4.587
2.328
2.491
2.718
2.879
3.106
3.497
4.437
2.303
2.461
2.681
2.836
3.055
3.428
4.318
2.282
2.436
2.650
2.801
3.012
3.372
4.221
2.264
2.415
2.624
2.771
2.977
3.326
4.140
2.249
2.397
2.602
2.746
2.947
3.286
4.073
2.235
2.382
2.583
2.724
2.921
3.252
4.015
2.224
2.368
2.567
2.706
2.898
3.222
3.965
2.214
2.356
2.552
2.689
2.878
3.197
3.922
120
2 2 2 2 9 8 285
2.205
2.346
2.539
2.674
2.861
3.174
3.883
2.197
2.336
2.528
2.661
2.845
3.153
3.850
2.189
2.328
2.518
2.649
2.831
3.135
3.819
2.183
2.320
2.508
2.639
2.819
3.119
3.792
2.177
2.313
2.500
2.629
2.807
3.104
3.768
24
2.172
2.307
2.492
2.620
2.797
3.091
3.745
2.167
2.301
2.485
2.612
2.787
3.078
3.725
2.162
2.296
2.479
2.605
2.779
3.067
3.707
2.158
2.291
2.473
2.598
2.771
3.057
3.689
28
2.154
2.286
2.467
2.592
2.763
3.047
3.674
29
2.150
2.282
2.462
2.586
2.756
3.038
3.660
30
2.147
2.278
2.457
2.581
2.750
3.030
3.646
40
2.123
2.250
2.423
2.542
2.704
2.971
3.551
60
2.099
2.223
2.390
2.504
2.660
2.915
3.460
2.076
2.196
2.358
2.468
2.617
2.860
3.373
2.054
2.170
2.326
2.432
2.576
2.807
3.290
0.02
0.015
0.01
0.0075
0.005
0.0025
0.0005
a
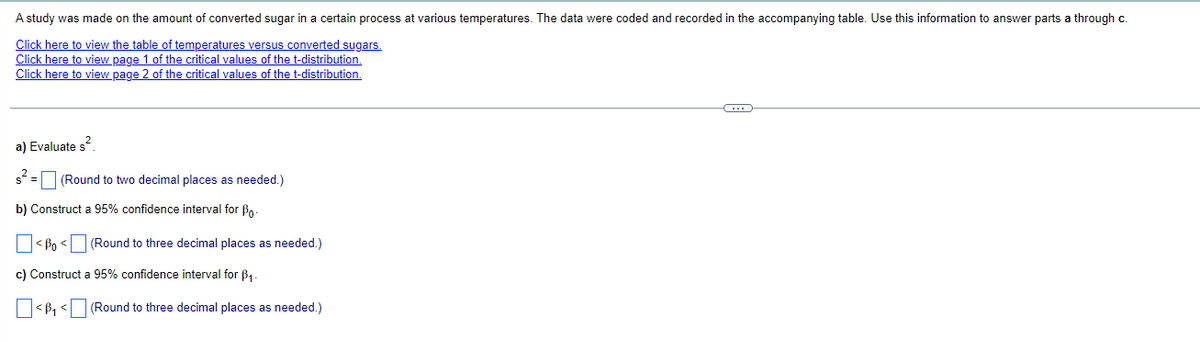
Transcribed Image Text:A study was made on the amount of converted sugar in a certain process at various temperatures. The data were coded and recorded in the accompanying table. Use this information to answer parts a through c.
Click here to view the table of temperatures versus converted sugars.
Click here to view page 1 of the critical values of the t-distribution.
Click here to view page 2 of the critical values of the t-distribution.
a) Evaluate s².
$² = (Round to two decimal places as needed.)
b) Construct a 95% confidence interval for Bo
<Bo<
(Round to three decimal places as needed.)
c) Construct a 95% confidence interval for ẞ₁.
☐ <B₁ < (Round to three decimal places as needed.)
Expert Solution
This question has been solved!
Explore an expertly crafted, step-by-step solution for a thorough understanding of key concepts.

Step by step
Solved in 2 steps with 5 images

Recommended textbooks for you
A First Course in Probability (10th Edition)
Probability
ISBN:
9780134753119
Author:
Sheldon Ross
Publisher:
PEARSON

A First Course in Probability (10th Edition)
Probability
ISBN:
9780134753119
Author:
Sheldon Ross
Publisher:
PEARSON