a temperature of 210°C has a specific entropy of 7.1167 kJ/kg•K. Determine the pressure, internal energy, enthalpy and volume.    Ans. 0.49 MPa, 2877.3 kJ/kg, 2659.7 kJk

icon
Related questions
Question

Can you answer this? For me i have a lot of difficulty on my subject. Thermodynamics

(5) Steam at a temperature of 210°C has a specific entropy of 7.1167 kJ/kg•K. Determine the pressure, internal energy, enthalpy and volume. 


Ans. 0.49 MPa, 2877.3 kJ/kg, 2659.7 kJkg, 0.4467 m3/kg


(6) Saturated steam vapor at 250°C moves along its isothern until the pressure becomes 1 MPa. Locate the end state points on the Mollier chart and for each kilogram of steam processed determine (a) the initial pressure, (b) the change of enthalpy, and (c) the change of entropy.


Ans. (a) 4 MPa, (b) 144 kJ/kg, (c) 0.90 kJ/kg•K


(7) Steam undergoes an isentalpic (h = C) process from 1.5 Mpa, 350°C to 10 MPa. Find the final temperature using the Mollier chart.

Ans. 418°C
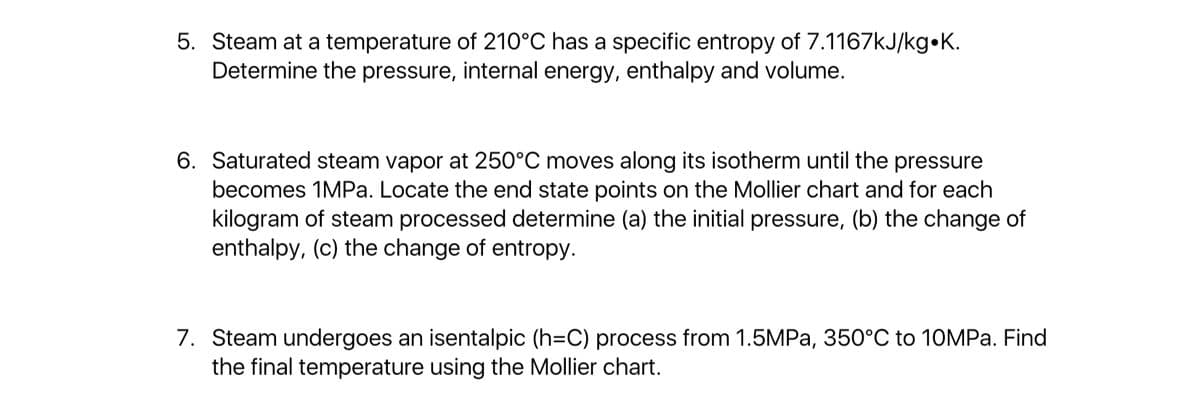
5. Steam at a temperature of 210°C has a specific entropy of 7.1167kJ/kg•K.
Determine the pressure, internal energy, enthalpy and volume.
6. Saturated steam vapor at 250°C moves along its isotherm until the pressure
becomes 1MPA. Locate the end state points on the Mollier chart and for each
kilogram of steam processed determine (a) the initial pressure, (b) the change of
enthalpy, (c) the change of entropy.
7. Steam undergoes an isentalpic (h=C) process from 1.5MPA, 350°C to 10MPa. Find
the final temperature using the Mollier chart.
Transcribed Image Text:5. Steam at a temperature of 210°C has a specific entropy of 7.1167kJ/kg•K. Determine the pressure, internal energy, enthalpy and volume. 6. Saturated steam vapor at 250°C moves along its isotherm until the pressure becomes 1MPA. Locate the end state points on the Mollier chart and for each kilogram of steam processed determine (a) the initial pressure, (b) the change of enthalpy, (c) the change of entropy. 7. Steam undergoes an isentalpic (h=C) process from 1.5MPA, 350°C to 10MPa. Find the final temperature using the Mollier chart.
Expert Solution
trending now

Trending now

This is a popular solution!

steps

Step by step

Solved in 2 steps

Blurred answer