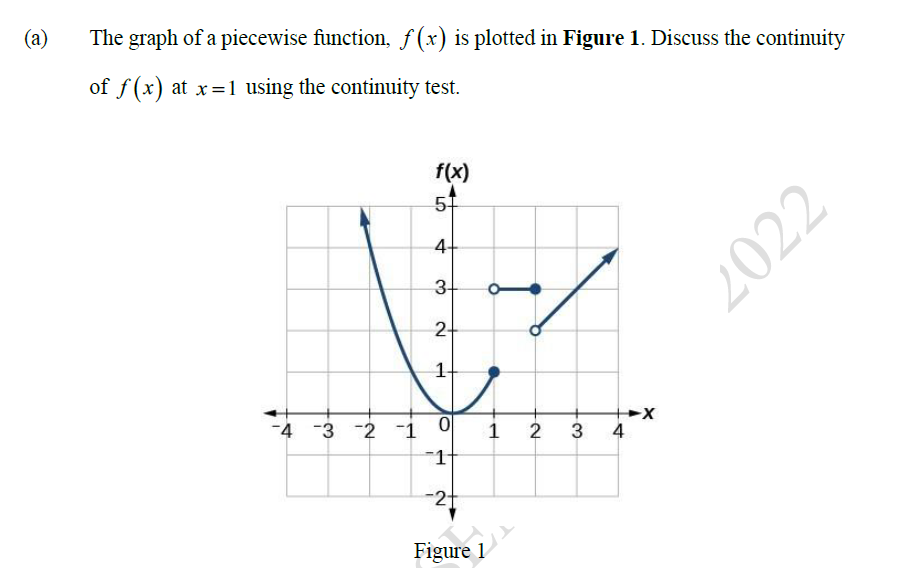
(a) The graph of a piecewise function, ƒ (x) is plotted in Figure 1. Discuss the continuity of f (x) at x=1 using the continuity test. f(x) 4+ 3- 2- -4 -3 -2 1 1 2 3 4 -2t Figure 1 2022 1.
(a) The graph of a piecewise function, ƒ (x) is plotted in Figure 1. Discuss the continuity of f (x) at x=1 using the continuity test. f(x) 4+ 3- 2- -4 -3 -2 1 1 2 3 4 -2t Figure 1 2022 1.

Algebra & Trigonometry with Analytic Geometry
13th Edition
ISBN:9781133382119
Author:Swokowski
Publisher:Swokowski
Chapter5: Inverse, Exponential, And Logarithmic Functions
Section5.3: The Natural Exponential Function
Problem 56E

Related questions
Question
Transcribed Image Text:(a)
The graph of a piecewise function, f (x) is plotted in Figure 1. Discuss the continuity
of f (x) at x=1 using the continuity test.
f(x)
51
4+
3-
2022
2-
-4 -3 -2 -1 0
1
2
3
4
-2+
Figure 1
Expert Solution
This question has been solved!
Explore an expertly crafted, step-by-step solution for a thorough understanding of key concepts.

Step by step
Solved in 2 steps with 1 images

Recommended textbooks for you
Algebra & Trigonometry with Analytic Geometry
Algebra
ISBN:
9781133382119
Author:
Swokowski
Publisher:
Cengage
Algebra & Trigonometry with Analytic Geometry
Algebra
ISBN:
9781133382119
Author:
Swokowski
Publisher:
Cengage