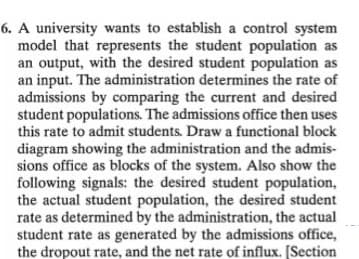
A university wants to establish a control system model that represents the student population as an output, with the desired student population as an input. The administration determines the rate of admissions by comparing the current and desired student populations. The admissions office then uses this rate to admit students. Draw a functional block diagram showing the administration and the admis- sions office as blocks of the system. Also show the following signals: the desired student population, the actual student population, the desired student rate as determined by the administration, the actual student rate as generated by the admissions office, the dropout rate, and the net rate of influx. [Section
A university wants to establish a control system model that represents the student population as an output, with the desired student population as an input. The administration determines the rate of admissions by comparing the current and desired student populations. The admissions office then uses this rate to admit students. Draw a functional block diagram showing the administration and the admis- sions office as blocks of the system. Also show the following signals: the desired student population, the actual student population, the desired student rate as determined by the administration, the actual student rate as generated by the admissions office, the dropout rate, and the net rate of influx. [Section
Chapter29: Service-entrance Calculations
Section: Chapter Questions
Problem 3R: a. What is the ampere rating of the circuits that are provided for the small-appliance loads? _____...
Related questions
Question

Transcribed Image Text:6. A university wants to establish a control system
model that represents the student population as
an output, with the desired student population as
an input. The administration determines the rate of
admissions by comparing the current and desired
student populations. The admissions office then uses
this rate to admit students. Draw a functional block
diagram showing the administration and the admis-
sions office as blocks of the system. Also show the
following signals: the desired student population,
the actual student population, the desired student
rate as determined by the administration, the actual
student rate as generated by the admissions office,
the dropout rate, and the net rate of influx. [Section
Expert Solution
This question has been solved!
Explore an expertly crafted, step-by-step solution for a thorough understanding of key concepts.
This is a popular solution!
Trending now
This is a popular solution!
Step by step
Solved in 2 steps with 1 images

Knowledge Booster
Learn more about
Need a deep-dive on the concept behind this application? Look no further. Learn more about this topic, electrical-engineering and related others by exploring similar questions and additional content below.Recommended textbooks for you

EBK ELECTRICAL WIRING RESIDENTIAL
Electrical Engineering
ISBN:
9781337516549
Author:
Simmons
Publisher:
CENGAGE LEARNING - CONSIGNMENT

Power System Analysis and Design (MindTap Course …
Electrical Engineering
ISBN:
9781305632134
Author:
J. Duncan Glover, Thomas Overbye, Mulukutla S. Sarma
Publisher:
Cengage Learning

EBK ELECTRICAL WIRING RESIDENTIAL
Electrical Engineering
ISBN:
9781337516549
Author:
Simmons
Publisher:
CENGAGE LEARNING - CONSIGNMENT

Power System Analysis and Design (MindTap Course …
Electrical Engineering
ISBN:
9781305632134
Author:
J. Duncan Glover, Thomas Overbye, Mulukutla S. Sarma
Publisher:
Cengage Learning