(a) Use a graph to show each constraint and the feasible region. Y 15 10 10 (X,Y)= 15 15 10 10 (c) What is the optimal value of the objective function? 15 X 4 Y 15 10 (b) Identify the optimal solution point on your graph. What are the values of X and Y at the optimal solution? 5 10 15 X 15 10 5 10 15 X (
(a) Use a graph to show each constraint and the feasible region. Y 15 10 10 (X,Y)= 15 15 10 10 (c) What is the optimal value of the objective function? 15 X 4 Y 15 10 (b) Identify the optimal solution point on your graph. What are the values of X and Y at the optimal solution? 5 10 15 X 15 10 5 10 15 X (

Practical Management Science
6th Edition
ISBN:9781337406659
Author:WINSTON, Wayne L.
Publisher:WINSTON, Wayne L.
Chapter6: Optimization Models With Integer Variables
Section6.5: Set-covering And Location-assignment Models
Problem 28P

Related questions
Question
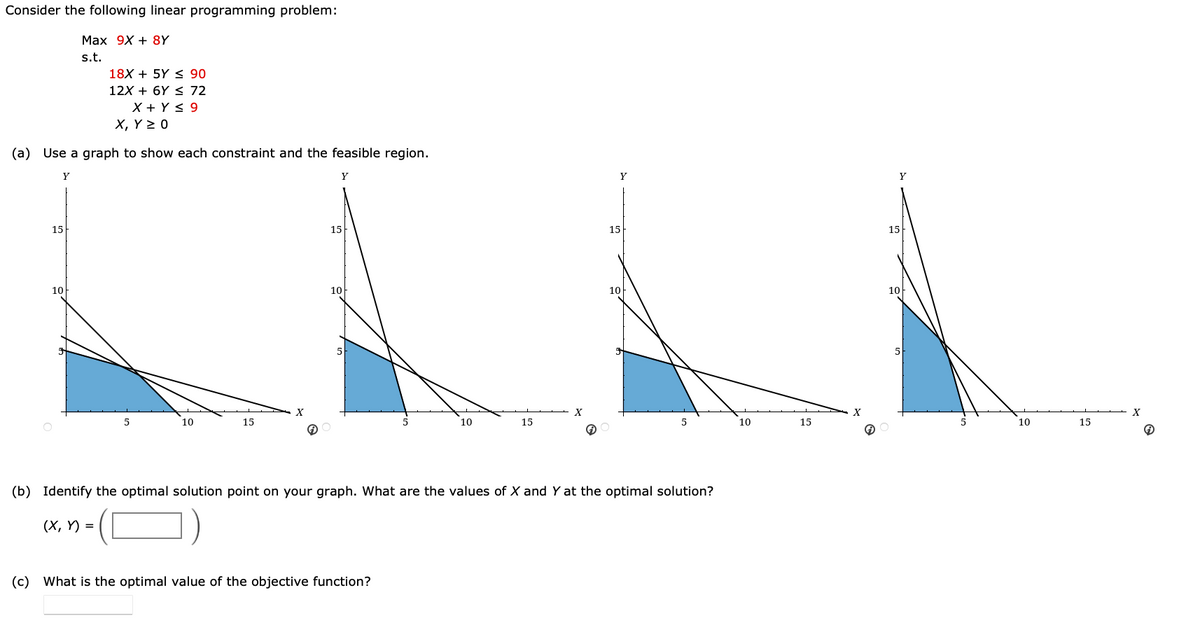
Transcribed Image Text:Consider the following linear programming problem:
Max 9X + 8Y
s.t.
15
(a) Use a graph to show each constraint and the feasible region.
Y
10
18X + 5Y 90
12X + 6Y ≤ 72
X + Y ≤ 9
O
X, Y Z 0
5
10
15
X
Y
15
10
5
10
(c) What is the optimal value of the objective function?
15
X
Y
15
10
5
(b) Identify the optimal solution point on your graph. What are the values of X and Y at the optimal solution?
(x, y) =
10
15
Y
15
10
G O
5
10
15
X
4
Expert Solution
This question has been solved!
Explore an expertly crafted, step-by-step solution for a thorough understanding of key concepts.

Step by step
Solved in 3 steps with 2 images

Recommended textbooks for you
Practical Management Science
Operations Management
ISBN:
9781337406659
Author:
WINSTON, Wayne L.
Publisher:
Cengage,
Practical Management Science
Operations Management
ISBN:
9781337406659
Author:
WINSTON, Wayne L.
Publisher:
Cengage,