(a) Using a function of the form y = a*b^x, with x = 0 in 1900 and y equal to the national debt in billions, model the data. (Round your coefficients to four decimal places.) y = (b) Use the model to predict the debt in 2017. (Round your answer to the nearest billion.) $ billion (c) Predict the year in which the debt will be $99 trillion ($99,000 billion). Need Help? Read It
(a) Using a function of the form y = a*b^x, with x = 0 in 1900 and y equal to the national debt in billions, model the data. (Round your coefficients to four decimal places.) y = (b) Use the model to predict the debt in 2017. (Round your answer to the nearest billion.) $ billion (c) Predict the year in which the debt will be $99 trillion ($99,000 billion). Need Help? Read It

Functions and Change: A Modeling Approach to College Algebra (MindTap Course List)
6th Edition
ISBN:9781337111348
Author:Bruce Crauder, Benny Evans, Alan Noell
Publisher:Bruce Crauder, Benny Evans, Alan Noell
Chapter3: Straight Lines And Linear Functions
Section3.3: Modeling Data With Linear Functions
Problem 18E: Tax Table Here are selected entries from the 2014 tax table that show the federal income tax owed by...

Related questions
Question
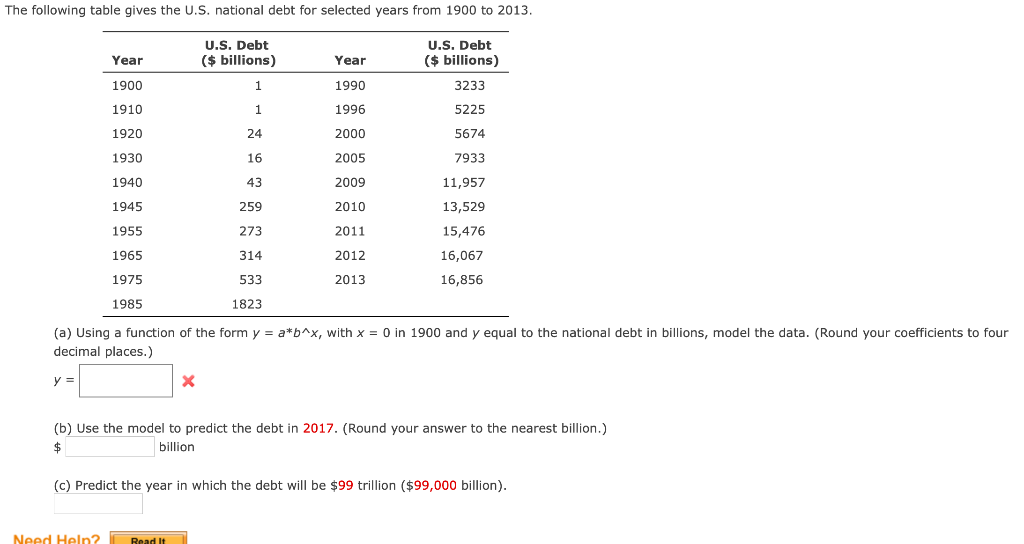
Transcribed Image Text:The following table gives the U.S. national debt for selected years from 1900 to 2013.
U.S. Debt
($ billions)
U.S. Debt
($ billions)
Year
Year
1900
1990
3233
1910
1996
5225
1920
24
2000
5674
1930
16
2005
7933
1940
43
2009
11,957
1945
259
2010
13,529
1955
273
2011
15,476
1965
314
2012
16,067
1975
533
2013
16,856
1985
1823
(a) Using a function of the form y = a*b^x, with x = 0 in 1900 and y equal to the national debt in billions, model the data. (Round your coefficients to four
decimal places.)
y =
(b) Use the model to predict the debt in 2017. (Round your answer to the nearest billion.)
$
billion
(c) Predict the year in which the debt will be $99 trillion ($99,000 billion).
Need Heln?
Read It
Expert Solution
This question has been solved!
Explore an expertly crafted, step-by-step solution for a thorough understanding of key concepts.

This is a popular solution!

Trending now
This is a popular solution!

Step by step
Solved in 3 steps with 2 images

Recommended textbooks for you
Functions and Change: A Modeling Approach to Coll…
Algebra
ISBN:
9781337111348
Author:
Bruce Crauder, Benny Evans, Alan Noell
Publisher:
Cengage Learning
Functions and Change: A Modeling Approach to Coll…
Algebra
ISBN:
9781337111348
Author:
Bruce Crauder, Benny Evans, Alan Noell
Publisher:
Cengage Learning