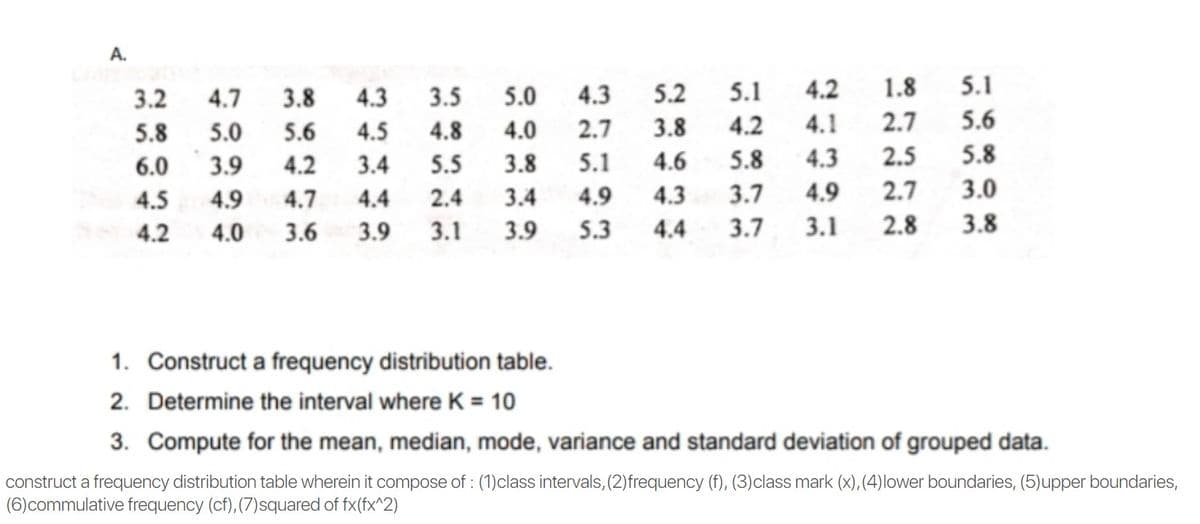
A. 3.2 4.7 3.8 4.3 3.5 5.0 4.3 5.2 5.1 4.2 1.8 5.1 5.8 5.0 5.6 4.5 4.8 4.0 2.7 3.8 4.2 4.1 2.7 5.6 6.0 3.9 4.2 3.4 5.5 3.8 5.1 4.6 5.8 4.3 2.5 5.8 4.5 4.9 4.7 4.4 2.4 3.4 4.9 4.3 3.7 4.9 2.7 3.0 4.2 4.0 3.6 3.9 3.1 3.9 5.3 4.4 3.7 3.1 2.8 3.8 1. Construct a frequency distribution table. 2. Determine the interval where K = 10 3. Compute for the mean, median, mode, variance and standard deviation of grouped data.
Q: Suppose a government organization reported the accompanying data on the number of speed-related…
A: a. To calculate the standard deviation for the New year's data Mean = 1n∑x Here n = 10 Mean =…
Q: Suppose a government organization reported the accompanying data on the number of speed-related…
A: Given data: Speed-Related Fatalities Year New Years Day (x1) Memorial Day (x2) July 4th (x3)…
Q: A statistics instructor asks each student in his classes to report how much the student spent on…
A: Data given X:405,385,495,385,555,470
Q: Nas corporation's manager in the stamping department have been studying the overhead cost and the…
A: Given Data : Month Overhead Machine hours January 5,030 2,730 February 1,600 600 March 7,210 3,403…
Q: You intend to estimate a population mean μμ from the following sample. 37.4 45.9 44.1 4.7 37.2 56.1…
A:
Q: table below. Cars in a Parking Lot Tuesday Wednesday Thursday 35 10 Friday 23 26 Saturday 38 39…
A: Definition used- Stem and Leaf plot - In a stem and leaf plot, each data value is…
Q: Based on the data shown y = 4. 14.48 16.8 6. 18.52 21.04 20.46 9 23.68 10 26.1 11 24.72 12 27.44 13…
A: From given data, X Y X*Y X*X 4 14.48 57.92 16 5 16.8 84 25 6 18.52 111.12 36 7 21.04…
Q: Find the Fan Cost Index for the Pittsburgh Steelers. Team Ticket Other Drink Soft Drink Hot Dog…
A: Team Pittsburgh Steelers Ticket $100.64 Other Drink $8.00 Soft Drink…
Q: Rank Player Money ($) Scoring Average DrDist DrAccu GIR 1 Vijay Singh 6,601,094 70.27 297.8 59.45…
A: e.The correlation coefficient for driving distance x and accuracy y is calculated by using Excel and…
Q: Median Rents in California Cities $5,000 $4,730 $4,500 $4,000 $3,500 $3,000 $2,740 $2,710 $2,500…
A: From the given graph we want to some reflection about this graph.
Q: Find the median for the following data set: 25 20 24 14 10 15 18.0 15 5.4 17.5
A:
Q: The table below is a measure of how many ounces of caffeinated coffee a person drinks and how much…
A: Solution-: Let, X=Ounces of coffee and Y=Hours of sleep We want to find, (a) Give the Pearson…
Q: The accompanying table lists the numbers of words spoken in a day by each member of 50 different…
A: Introduction: Denote μ1, μ2 as the true mean number of words spoken per day by males and females,…
Q: numBrands sales 15 651.06 30 728.92 19…
A: Since you have posted a question with multiple sub-parts, we will solve first three sub-parts for…
Q: uppose the following data show the percentage of 17- to 24-year-olds who are attending college in…
A: Anova: Single Factor SUMMARY Groups Count Sum Average Variance…
Q: Find the mode of the following: 1, 1, 3, 3, 3, 5, 5, 8, 9 O 1 O 3 O 5 O 8 O 9 Question 17 Find the…
A: Given data is,1, 1, 3, 3, 3, 5, 5, 8, 9
Q: County Cancer Per 100,000, 2009-2013 2010 Median Income Household Dollars Androscoggin County(6,10)…
A: Introduction: It is understood that the independent variable is cancer per 1000, and the dependent…
Q: Find the median for the following data set: 13 23 11 26 22 18 O 20 5.4 15 18.8
A: Find Median = ?
Q: The following table presents the manufacturer's suggested retail price (in automobiles. 50.1 70.4…
A: Given, 50.1 ,70.4, 55.2, 56.7, 74.9, 55.7, 55.2, 64.2, 39.3, 80.6, 36.9, 108.4 , 47.8, 90.5 , 47.5,…
Q: numBrands sales 15 651.06 30 728.92 19…
A: In simple linear regression, there will be exactly on independent and dependant variable. The value…
Q: Make a stemplot for the following data and explain your observations: 13 66 36 12 8 27 7 7 52 48 15…
A: Stem and leaf plot is a graph which split into two parts as stem and leaf. Where stem is usually…
Q: Consider the report cards for Sam and Samantha given below. 国 Sam Samantha Credits Letter Grade…
A:
Q: The following frequency table contains the total number of deaths worldwide as a result of…
A: Solution: We have given frequency table that contains the total number of deaths worldwide as a…
Q: South Salinas Price 599 465 595 1185 640 566 499 611 439 512 999 755 405 650 489 652 629 420 639 482…
A: linear correlation between price and square feet in North Salinas
Q: A statistics instructor asks each student in his classes to report how much the student spent on…
A: Excel function to find population variance is as follows, =VAR.P( number1, number2 .............)…
Q: Find the Median for the following data series. 12, 35, 48, 54, 62, 85, 25, 32 a. 41.5 b. 40.5 c.…
A:
Q: Calculate the mean and standard deviation for Mill 1 Calculate the mean and standard deviation for…
A:
Q: state the domain and range for each relation. Then determine whether each relation represents a…
A:
Q: Here are the collected data on weekly sales commissions: Weekly Commission New Plan Old Plan 1 2 3 4…
A: Given Information: Consider the given weekly sales commission data.
Q: Most people think London, England is one of the rainiest cities in the world. However, it receives…
A: Average = (x1+ X2+ X3 + -------+ xn)/n
Q: Find the Median for the following data series. 18, 16, 12, 15, 32,…
A:
Q: 2.42 1.44 2.05 0.24 2.78 2.6 2.69 1.02 1.44 1.21 2.85 0.91 1.54 0.37 1.07 0.04 2.41 2.79 1.25 0.63…
A: We have used excel to compute the mean. Following steps are used:- 1) Enter the data ( speed and…
Q: Calculate the 60th percentle of the data shown 美 4.2 7.7 8.6 13.7 15.1 17.9 20.1 20.3 20.4 21.5 24.2…
A: Since, you have asked multiple question, we will solve the first question for you. If you want any…
Q: A researcher is interested to see if income is related to education level. Income (Dollars)…
A: Given: Income (Dollars) Education (Years) 36577 11 54365 12 33542 10 65654 12 45765 11…
Q: he instructor takes a random sample of size from the population data and obtains the following…
A: Given data is 405, 385 , 495, 385, 555, 470sample size(n)=6sample…
Q: The following data represent the square footage of 10 three-bedroom condos for sale in Hilton Head,…
A: We first need to rearrange the given data set, 1126,1167,1264,1300,1321,1559,1625,1676,1858,2058
Q: Q2. Please create the best chart you think that can visualize the population change of top three…
A: The best way to create a chart representing the top three largest countries in NE (countries with…
Q: Country Region 2011 Value 2012 Value 2013 Value 2014 Value 1=North and South Canada 1 $16,290.00…
A: Country Region 2011 2012 2013 2014 1 Canada 1 16290 15395 16863 17064 2 Mexico 1 2611 2606…
Q: 0 – 4 25 5 – 9 15 10 – 14 6 15 – 19 0 20 – 24…
A: Solution-: We estimate the median=?
Q: b) The table below shows the number of photocopies made by Kenyatta University students at three…
A: Solution : Given : Number of photocopies made by Kenyatta University students at three locations…
Q: Population 15,855 28,951 142,547 2,801,561 2,714,664 2,503,344 1,999,877 1,689,908 1,523,665…
A: Given, City population jan feb mar Arvada 15,855 10,505 24,556 12,564 Centenntial 28,951…
Q: Goshen Inc.'s monthly net income for 2019 were as follow, what is the average net income? January:…
A: The solution is given as follows :
Q: the table below. List Price (B) Discount Rate (R) Discount (P) Net Invoice Price NIP Rate P158.75 5%…
A: LIST PRICE = 158.75 UNIT DISCOUNT RATE = 5% : . DISCOUNT = 158.75 X 0.05 UNIT = 7.9375 UNIT : . NET…
Q: One question from a survey was "How many credit cards do you currently have?" The results of the…
A: The formula of the standard deviation is,
Q: numBrands sales 15 651.06 30 728.92 19…
A: Hello thanks for your question. Since you have posted a question with multiple sub-parts, we will…
Q: The accompanying table lists the numbers of words spoken in a day by each member of 58 different…
A: Solution : Part a) We have given data. In part a) We have to test the claim that among couples,…
Q: Time of Day Customers Served 7:00 10 7:15 25 7:30 30 7:45 75 8:00 100 8:15 135 8:30 140 8:45 100…
A: According to question We have to define the graph of the table is Linear/Quadratic or Exponential.…
Q: Listed are the net sales for a San Francisco-area mail-order retailer for the years 2009 to 2018.…
A: Given : Year Sales(millions) 2009 486.6 2010 506.8 2011 522.2 2012 574.6 2013 580.7…
Q: C. The monthly income of 17 government employees 18,000, 24,000, 22,000, 23,000, 17,000, 32,000,…
A: ( c ) For the given data Find Range = ? Variance = ? Standard deviation =?
Q: South Salinas Price 599 465 595 1185 640 566 499 611 439 512 999 755 405 650 489 652 629 420 639 482…
A: Here to test the linear correlation between price & square feet in south Salinas So ; using…
Trending now
This is a popular solution!
Step by step
Solved in 3 steps
- The following data is based on the monthly fees paid by 50 internet users in the year 2000. 8, 9, 10, 10, 12, 13, 14, 15, 15, 15, 15, 18, 18, 19, 19, 20, 20, 20, 20, 20, 20, 20, 20, 20, 20, 20, 20, 20, 21, 21, 21, 21, 21, 22, 22, 22, 22, 22, 22, 22, 22, 22, 23, 25, 29, 30, 35, 40, 40, 50 Construct the five-number summary of the data. Minimum=_____________ Q1=_______________ Median=____________ Q3=________________ Maximum=______________ Use summary statistics and plain English to summarize the data. Compute the upper fence and lower fence. Stat all possible outliers.Rank Player Money ($) Scoring Average DrDist DrAccu GIR 1 Vijay Singh 6,601,094 70.27 297.8 59.45 68.45 2 Phil Mickelson 5,188,875 70.28 295.7 55.27 65.81 3 Sergio Garcia 4,858,224 70.6 294.6 59.39 67.06 4 Kenny Perry 4,663,794 70.21 296 61.97 67.47 5 Anthony Kim 4,656,265 70.22 300.9 58.34 65.78 6 Camilo Villegas 4,422,641 70.6 293.3 58.15 64.6 7 Padraig Harrington 4,313,551 70.7 296.3 59.37 60.67 8 Stewart Cink 3,979,301 70.65 296.9 55.27 66.94 9 Justin Leonard 3,943,542 70.41 281.4 67.72 66.61 10 Robert Allenby 3,606,700 70.64 291.7 65.64 70.4 11 Jim Furyk 3,455,714 70.56 280.4 69.37 66.78 12 Ryuji Imada 3,029,363 71.13 278.6 59.64 61.39 13 Mike Weir 3,020,135 70.68 284.8 62.46 64.62 14 Geoff Ogilvy 2,880,099 71.38 292.1 58.18 61.89 15 K.J. Choi 2,683,442 71.01 286.1 61.38 65.48 16 Ben Curtis 2,615,798 70.96 284.7 67.2 63.45 17 Kevin Sutherland 2,581,311 70.22 291 61.93 68.2 18 Trevor Immelman 2,566,199 71.85 291.3 62.45 63.07 19 Ernie Els…Find the mean of the following data set:27, 28, 30, 41, 43, 44, 45, 51, 51, 53, 53,54, 56, 56, 56, 57, 57, 58, 58, 59, 61, 62,62, 62, 63, 64, 67, 68, 68, 68, 69, 69, 74 5757 5151 6868 55.58
- Find the frequeng Distinoution table grouped Data of ? 16,19,18,13 11,17,11,10 10,18,13,15 15,15,20,24 11,14,20,0 12,16,16,12 20,11,12,16 11,16,23,9 16,12,16,23 12,18,11,13Calculate the mean and median of the following data: 57, 19, 50, 52, 29, 53, 22, 4357, 19, 50, 52, 29, 53, 22, 43 Mean = Median =The data below is from https://www.worldometers.info/world-population/mexico-population/ Year Population of Mexico 2020 128,932,753 2019 127,575,529 2018 126,190,788 2017 124,777,324 2016 123,333,376 2015 121,858,258 2010 114,092,963 2005 106,005,203 2000 98,899,845 1995 91,663,285 1990 83,943,132 1985 75,983,485 1980 67,761,372 1975 59,607,953 1970 51,493,565 1965 44,123,853 1960 37,771,859 1955 32,350,596 1.. Show how you can verify that your linear model works for this data. (Keep trying until it works, and then come back and prove that it works here.) 2. Use your linear model to predict the population in 2050. Show work, sentence answer. 3. Explain whether you think a linear model is a reasonable approximation. Give specific reasons for your answer.
- You intend to estimate a population mean μ from the following sample. 49.5 43.2 92.8 60.2 77 104.8 41.2 82.7 45.9 66.7 89.5 79.1 48.3 79 55.7 66.6 54.7 46.4 76.7 53.3 52.2 82.9 50.9 62.8 78.6 53.4 42.7 77.8 55.5 79 74.8 89.8 76.8 73.3 67.6 81.6 54.5 54.9 68.3 73.7 77.1 73.9 54.6 95.7 56.7 50.7 63.8 68.5 54.1 77.2 63.8 44.1 54.2 63.2 86.2 70.8 77.1 74.1 67.2 45.5 66.3 Find the 99.9% confidence interval. Enter your answer as a tri-linear inequality accurate to two decimal place (because the sample data are reported accurate to one decimal place).The Russel Reynold Association surveyed retired senior executives who had returned to work. They found that after returning to work, 38% were employed by another organization, 32% were self-employed, 23% were either freelancing or consulting, and 7% had formed their own companies. To see if these percentages are consistent with those of Allegheny County residents, a local researcher surveyed 300 retired executives who had returned to work and found that 122 were working for another company, 85 were self-employed, 76 were either freelancing or consulting, and 17 had formed their own companies. State the null and alternative hypothesis and identify the claim, at α=0.10 to test the claim that the percentages are the same for those people in Allegheny Country.find mean median and mode 42,45,47,48,42,40,45,46,48,47,49,42,41,40,45,45,45,48,46,42,48,45,45,43,45,41,47
- 10- If you have the following data 27, 25, 34, 36, 20, 27, 33, 27, 30, 29, then the value of the median hasYou intend to estimate a population mean μ from the following sample. 35.9 51 45.2 56.2 56.1 48.2 51.8 34 48.2 55.1 50.1 44.7 51.4 52.6 40.4 35 45.8 39 46.1 46.3 41.6 58.7 55 53.4 40.3 45.4 49.1 41 47.9 39.5 46.4 44.2 40.8 48.4 38.2 50.6 47 55.9 46 52.6 44.2 58.9 39.4 51.9 49.6 56.3 46.1 50.3 63.7 44.8 53.4 48.5 48.3 50 46.6 Find the 90% confidence interval. Enter your answer as a tri-linear inequality accurate to two decimal place (because the sample data are reported accurate to one decimal place).< μ < Answer should be obtained without any preliminary rounding. However, the critical value may be rounded to 3 decimal places.You intend to estimate a population mean μμ from the following sample. 9 49.4 39 4.3 18.4 49.9 52.4 13.6 30.7 57.5 17.4 48 46.4 8.2 28 84 19.7 60.5 23.2 43.1 64.5 35.4 54 53.3 16.9 33.9 13.5 24.6 45.8 34.2 38.2 75.9 36.4 14.2 4.7 48.3 36.2 47.4 47.3 12.7 68.3 37.7 14.4 -30.3 68.7 34.8 0.8 13.1 40.8 -3.1 16.2 24.4 15.5 18.3 43.9 -0.1 57.7 13.6 37.7 44.9 Find the 99% confidence interval. Enter your answer as a tri-linear inequality accurate to two decimal place (because the sample data are reported accurate to one decimal place). < μ < Answer should be obtained without any preliminary rounding. However, the critical value may be rounded to 3 decimal places.