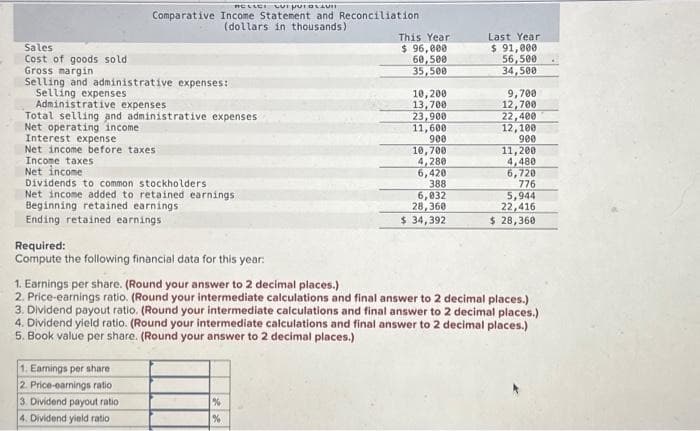
ACCICE corporat Comparative Income Statement and Reconciliation (dollars in thousands). Sales Cost of goods sold Gross margin Selling and administrative expenses: Selling expenses Administrative expenses Total selling and administrative expenses Net operating income Interest expense Net income before taxes Income taxes Net income Dividends to common stockholders Net income added to retained earnings Beginning retained earnings Ending retained earnings Required: Compute the following financial data for this year: 1. Earnings per share 2. Price-earnings ratio 3. Dividend payout ratio 4. Dividend yield ratio This Year $ 96,000 60,500 35,500 % % 10,200 13,700 23,900 11,600 900 10,700 4,280 6,420 388 6,032 28,360 $ 34,392 Last Year $ 91,000 56,500 34,500 9,700 12,700 22,400 12,100 900 1. Earnings per share. (Round your answer to 2 decimal places.) 2. Price-earnings ratio. (Round your intermediate calculations and final answer to 2 decimal places.) 3. Dividend payout ratio. (Round your intermediate calculations and final answer to 2 decimal places.) 4. Dividend yield ratio. (Round your intermediate calculations and final answer to 2 decimal places.) 5. Book value per share. (Round your answer to 2 decimal places.) 11,200 4,480 6,720 776 5,944 22,416 $ 28,360
ACCICE corporat Comparative Income Statement and Reconciliation (dollars in thousands). Sales Cost of goods sold Gross margin Selling and administrative expenses: Selling expenses Administrative expenses Total selling and administrative expenses Net operating income Interest expense Net income before taxes Income taxes Net income Dividends to common stockholders Net income added to retained earnings Beginning retained earnings Ending retained earnings Required: Compute the following financial data for this year: 1. Earnings per share 2. Price-earnings ratio 3. Dividend payout ratio 4. Dividend yield ratio This Year $ 96,000 60,500 35,500 % % 10,200 13,700 23,900 11,600 900 10,700 4,280 6,420 388 6,032 28,360 $ 34,392 Last Year $ 91,000 56,500 34,500 9,700 12,700 22,400 12,100 900 1. Earnings per share. (Round your answer to 2 decimal places.) 2. Price-earnings ratio. (Round your intermediate calculations and final answer to 2 decimal places.) 3. Dividend payout ratio. (Round your intermediate calculations and final answer to 2 decimal places.) 4. Dividend yield ratio. (Round your intermediate calculations and final answer to 2 decimal places.) 5. Book value per share. (Round your answer to 2 decimal places.) 11,200 4,480 6,720 776 5,944 22,416 $ 28,360

Excel Applications for Accounting Principles
4th Edition
ISBN:9781111581565
Author:Gaylord N. Smith
Publisher:Gaylord N. Smith
Chapter13: Earnings Per Share (eps)
Section: Chapter Questions
Problem 2R: Ponce Towers, Inc., had 50,000 shares of common stock and 10,000 shares of 100 par value, 8%...

Related questions
Question
Transcribed Image Text:HELLCI LUI PUEBLAVI
Comparative Income Statement and Reconciliation
(dollars in thousands)
Sales
Cost of goods sold
Gross margin
Selling and administrative expenses:
Selling expenses
Administrative expenses
Total selling and administrative expenses
Net operating income
Interest expense
Net income before taxes
Income taxes
Net income
Dividends to common stockholders
Net income added to retained earnings
Beginning retained earnings
Ending retained earnings
Required:
Compute the following financial data for this year:
1. Earnings per share
2. Price-earnings ratio
3. Dividend payout ratio
4. Dividend yield ratio
This Year
$ 96,000
60,500
35,500
%
%
10,200
13,700
23,900
11,600
900
10,700
4,280
6,420
388
6,032
28,360
$ 34,392
Last Year
$ 91,000
56,500
34,500
9,700
12,700
22,400
12,100
900
11,200
4,480
6,720
776
1. Earnings per share. (Round your answer to 2 decimal places.)
2. Price-earnings ratio. (Round your intermediate calculations and final answer to 2 decimal places.)
3. Dividend payout ratio. (Round your intermediate calculations and final answer to 2 decimal places.)
4. Dividend yield ratio. (Round your intermediate calculations and final answer to 2 decimal places.)
5. Book value per share. (Round your answer to 2 decimal places.)
5,944
22,416
$ 28,360
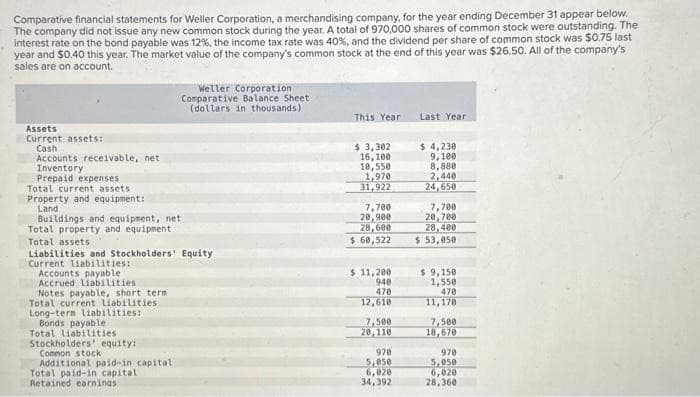
Transcribed Image Text:Comparative financial statements for Weller Corporation, a merchandising company, for the year ending December 31 appear below.
The company did not issue any new common stock during the year. A total of 970,000 shares of common stock were outstanding. The
interest rate on the bond payable was 12%, the income tax rate was 40 %, and the dividend per share of common stock was $0.75 last
year and $0.40 this year. The market value of the company's common stock at the end of this year was $26.50. All of the company's
sales are on account.
Assets
Current assets:
Cash
Accounts receivable, net
Inventory
Prepaid expenses
Total current assets
Property and equipment:
Land
Buildings and equipment, net
Total property and equipment
Total assets
Liabilities and Stockholders' Equity
Current liabilities:
Accounts payable
Accrued liabilities
Weller Corporation
Comparative Balance Sheet
(dollars in thousands)
Notes payable, short term
Total current liabilities
Long-term liabilities:
Bonds payable
Total liabilities
Stockholders' equity:
Common stock
Additional paid-in capital.
Total paid-in capital.
Retained earnings
This Year
$ 3,302
16,100
10,550
1,970
31,922
7,700
20,900
28,600
$ 60,522
$ 11,200
940
470
12,610
7,500
20,110
978
5,050
6,020
34,392
Last Year
$ 4,230
9,100
8,880
2,440
24,650
7,700
20,700
28,400
$ 53,050
$ 9,150
1,550
470
11,170
7,500
18,670
978
5,050
6,020
28,360
Expert Solution
This question has been solved!
Explore an expertly crafted, step-by-step solution for a thorough understanding of key concepts.

Step by step
Solved in 3 steps with 2 images

Knowledge Booster


Learn more about
Need a deep-dive on the concept behind this application? Look no further. Learn more about this topic, accounting and related others by exploring similar questions and additional content below.Recommended textbooks for you
Excel Applications for Accounting Principles
Accounting
ISBN:
9781111581565
Author:
Gaylord N. Smith
Publisher:
Cengage Learning

Financial Reporting, Financial Statement Analysis…
Finance
ISBN:
9781285190907
Author:
James M. Wahlen, Stephen P. Baginski, Mark Bradshaw
Publisher:
Cengage Learning

Managerial Accounting
Accounting
ISBN:
9781337912020
Author:
Carl Warren, Ph.d. Cma William B. Tayler
Publisher:
South-Western College Pub
Excel Applications for Accounting Principles
Accounting
ISBN:
9781111581565
Author:
Gaylord N. Smith
Publisher:
Cengage Learning
Financial Reporting, Financial Statement Analysis…
Finance
ISBN:
9781285190907
Author:
James M. Wahlen, Stephen P. Baginski, Mark Bradshaw
Publisher:
Cengage Learning
Managerial Accounting
Accounting
ISBN:
9781337912020
Author:
Carl Warren, Ph.d. Cma William B. Tayler
Publisher:
South-Western College Pub

Managerial Accounting: The Cornerstone of Busines…
Accounting
ISBN:
9781337115773
Author:
Maryanne M. Mowen, Don R. Hansen, Dan L. Heitger
Publisher:
Cengage Learning

Intermediate Accounting: Reporting And Analysis
Accounting
ISBN:
9781337788281
Author:
James M. Wahlen, Jefferson P. Jones, Donald Pagach
Publisher:
Cengage Learning

Financial Accounting: The Impact on Decision Make…
Accounting
ISBN:
9781305654174
Author:
Gary A. Porter, Curtis L. Norton
Publisher:
Cengage Learning