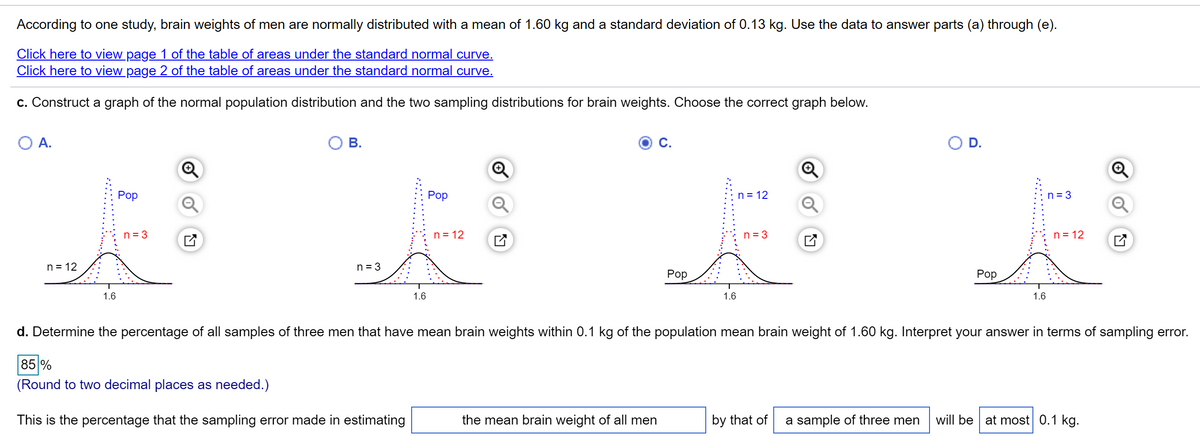
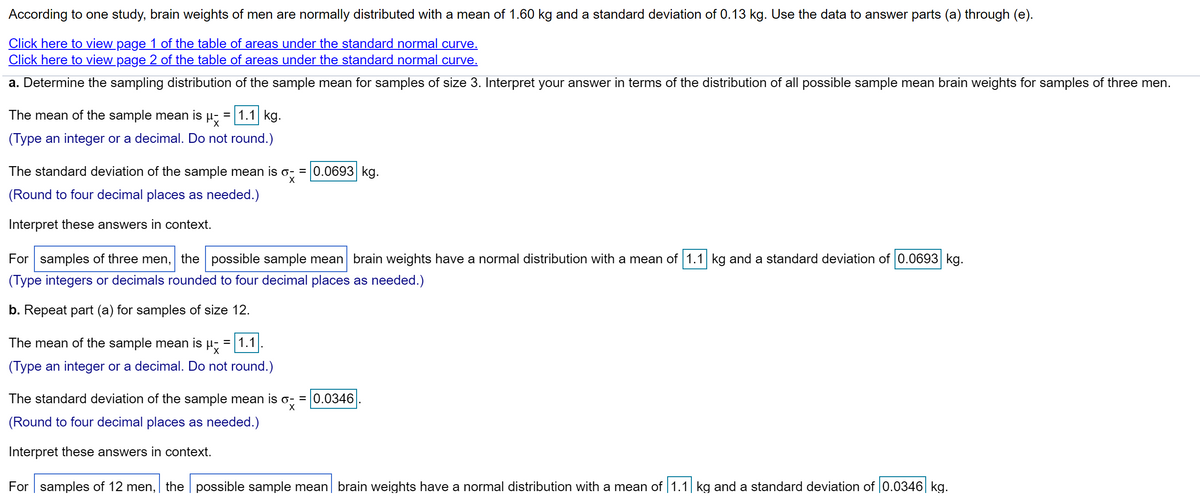
According to one study, brain weights of men are normally distributed with a mean of 1.60 kg and a standard deviation of 0.13 kg. Use the data to answer parts (a) through (e). Click here to view page 1 of the table of areas under the standard normal curve. Click here to view page 2 of the table of areas under the standard normal curve, a. Determine the sampling distribution of the sample mean for samples of size 3. Interpret your answer in terms of the distribution of all possible sample mean brain weights for samples of three men. The mean of the sample mean is µ; = 1.1 kg. (Type an integer or a decimal. Do not round.) The standard deviation of the sample mean is o: = 0.0693 kg. (Round to four decimal places as needed.) Interpret these answers in context. For samples of three men, the possible sample mean brain weights have a normal distribution with a mean of 1.1 kg and a standard deviation of 0.0693 kg. (Type integers or decimals rounded to four decimal places as needed.) b. Repeat part (a) for samples of size 12. The mean of the sample mean is u: =|1.1| (Type an integer or a decimal. Do not round.) The standard deviation of the sample mean is o: = 0.0346. (Round to four decimal places as needed.) Interpret these answers in context. For samples of 12 men, the possible sample mean brain weights have a normal distribution with a mean of 1.1 kg and a standard deviation of 0.0346 kg.


Continuous Probability Distributions
Probability distributions are of two types, which are continuous probability distributions and discrete probability distributions. A continuous probability distribution contains an infinite number of values. For example, if time is infinite: you could count from 0 to a trillion seconds, billion seconds, so on indefinitely. A discrete probability distribution consists of only a countable set of possible values.
Normal Distribution
Suppose we had to design a bathroom weighing scale, how would we decide what should be the range of the weighing machine? Would we take the highest recorded human weight in history and use that as the upper limit for our weighing scale? This may not be a great idea as the sensitivity of the scale would get reduced if the range is too large. At the same time, if we keep the upper limit too low, it may not be usable for a large percentage of the population!


Trending now
This is a popular solution!

Step by step
Solved in 4 steps


