
Glencoe Algebra 1, Student Edition, 9780079039897, 0079039898, 2018
18th Edition
ISBN:9780079039897
Author:Carter
Publisher:Carter
Chapter10: Statistics
Section10.1: Measures Of Center
Problem 14PPS

Related questions
Question
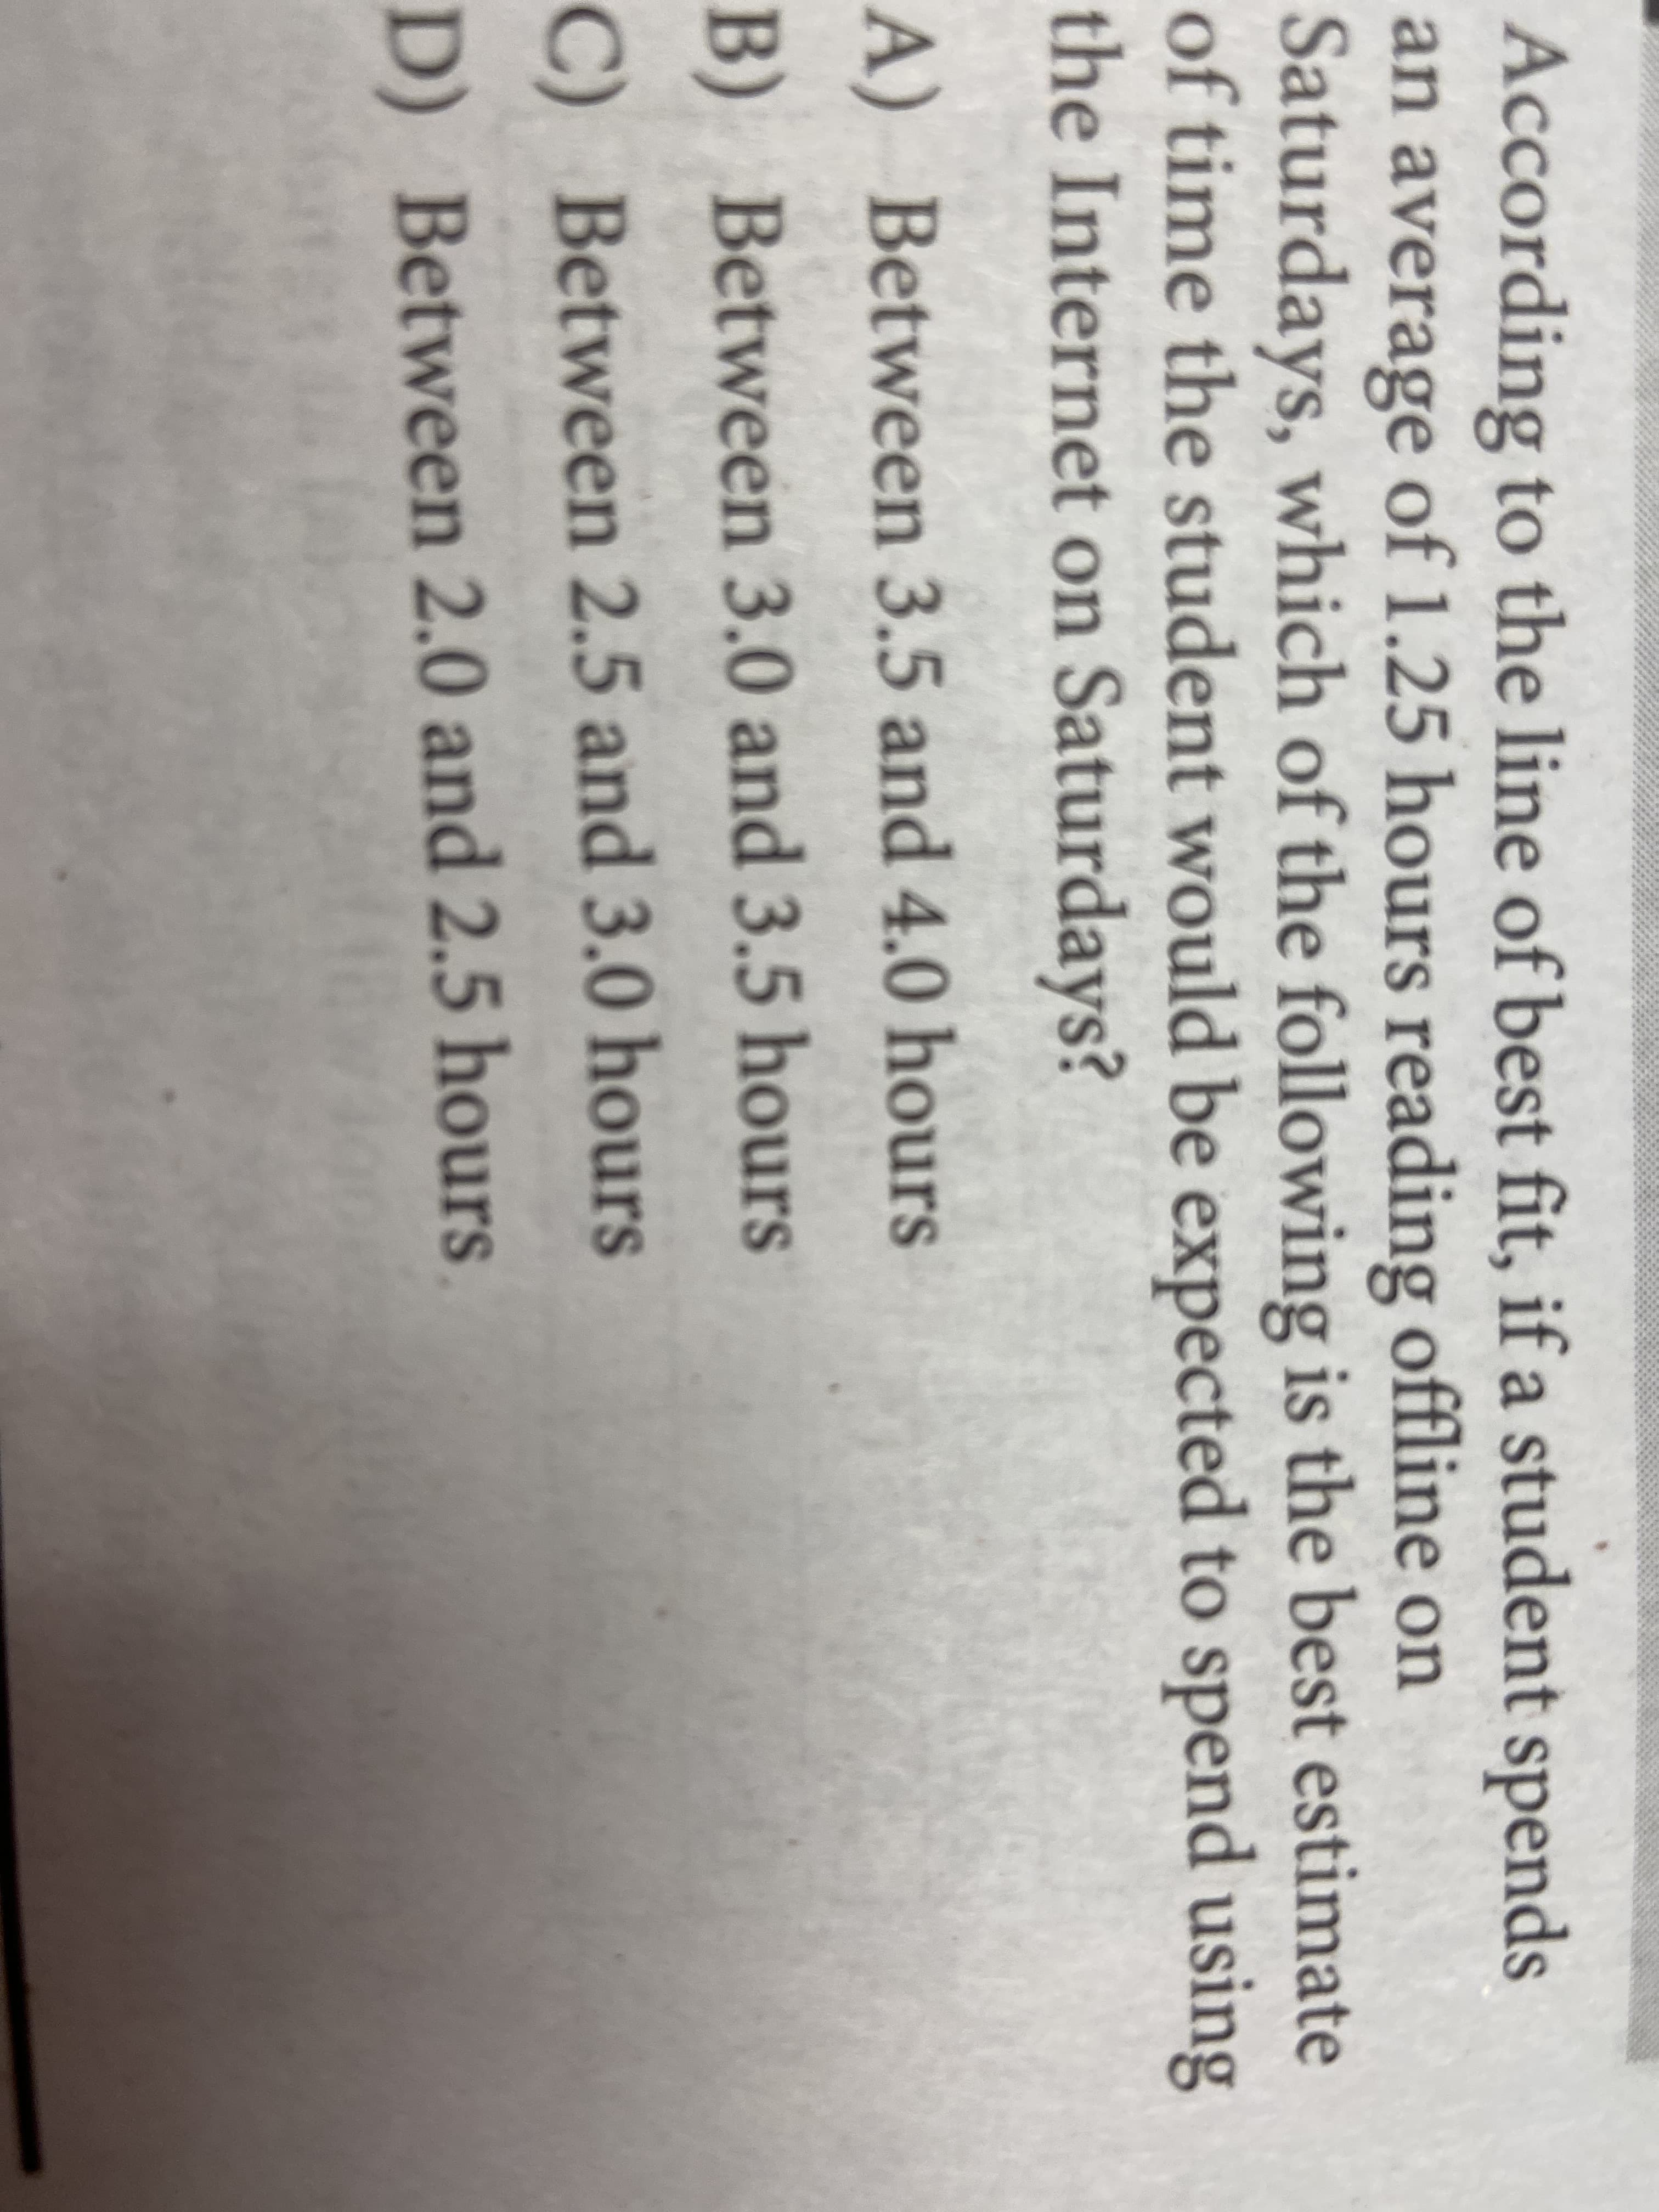
Transcribed Image Text:According to the line of best fit, if a student spends
an average of 1.25 hours reading offline on
Saturdays, which of the following is the best estimate
of time the student would be expected to spend using
the Internet on Saturdays?
A) Between 3.5 and 4.0 hours
B) Between 3.0 and 3.5 hours
C) Between 2.5 and 3.0 hours
D) Between 2.0 and 2.5 hours
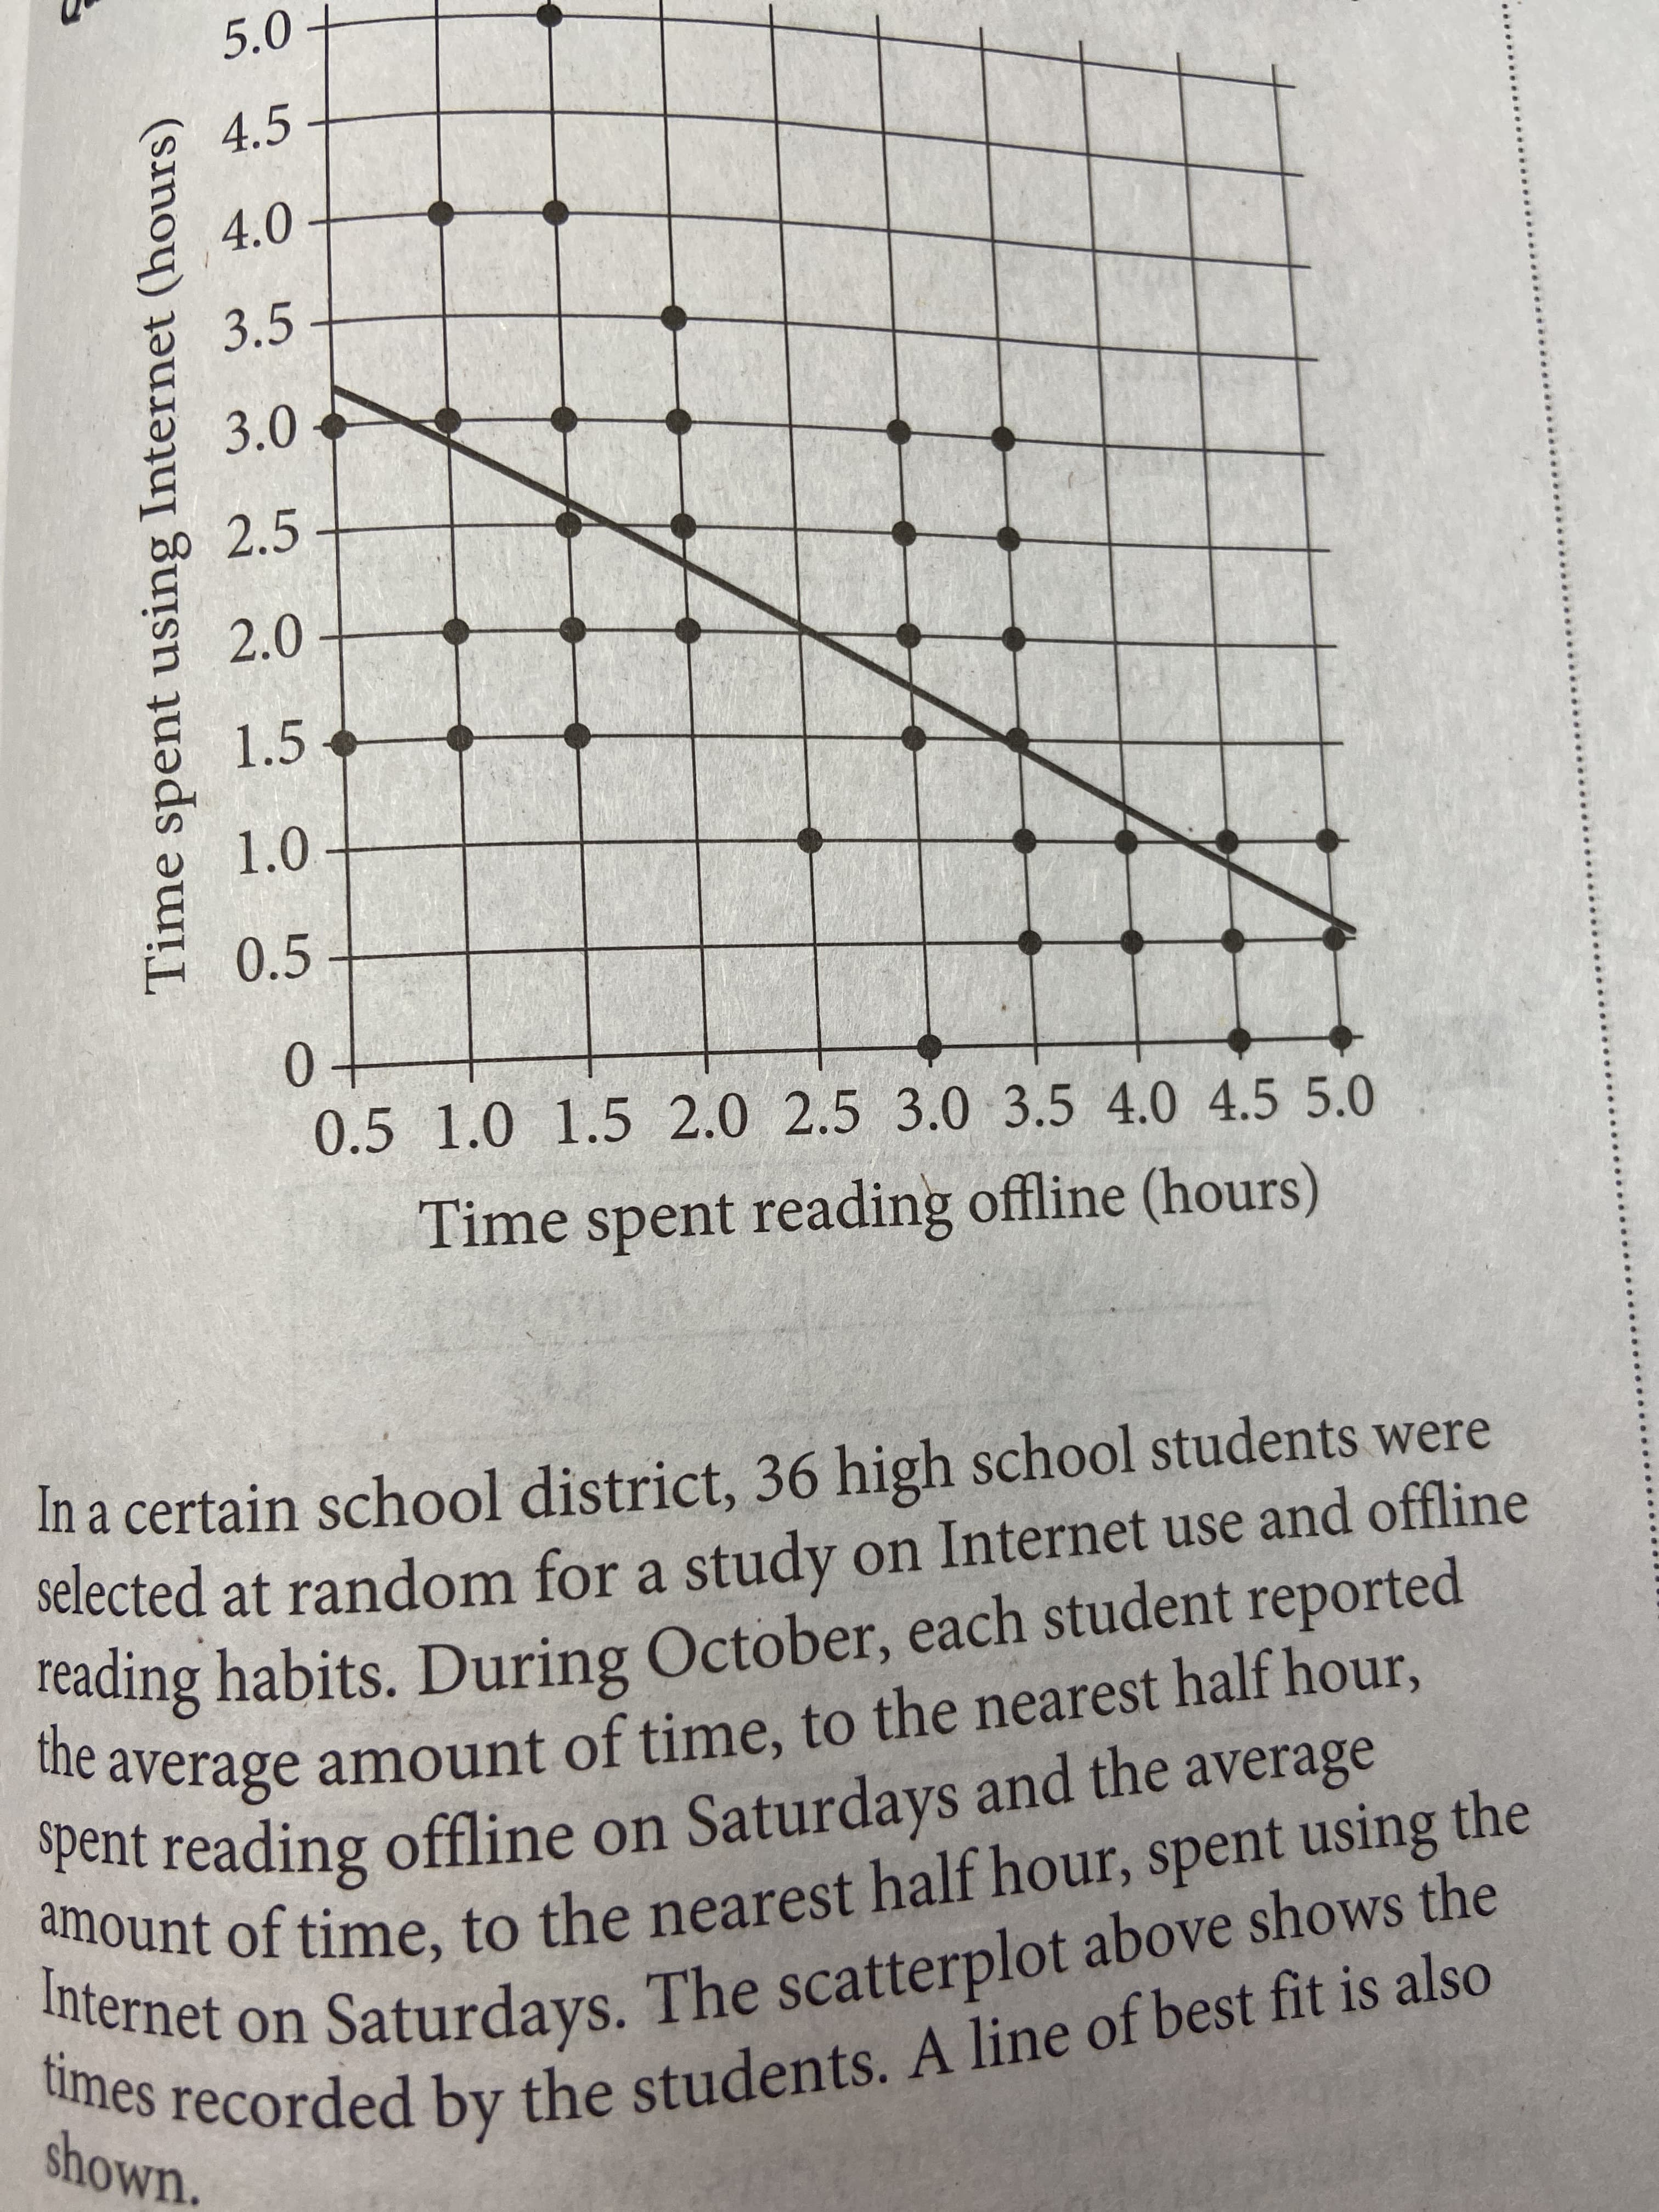
Transcribed Image Text:Time spent using Internet (hours)
10
5.0
amount of to the half the
times the A line of best fit is also
4.5
Internet on The above the
4.0
3.5
3.0
2.5
2.0
1.5
0.5
0.51.0 1.5 2.0 2.5 3.0 3.5 4.0 4.5 5.0
Time spent reading offline (hours)
In a certain school district, 36 high school students were
selected at random for a study on Internet use and offline
reading habits. During October, each student reported
ie average amount of time, to the nearest half hour,
the
opent reading offline on Saturdays and the average
hount of time, to the nearest half hour, spent using
the
fiet on Saturdays. The scatterplot above shows the
also
es recorded by the students. A line of best fit is
shown.
Expert Solution
This question has been solved!
Explore an expertly crafted, step-by-step solution for a thorough understanding of key concepts.

This is a popular solution!

Trending now
This is a popular solution!

Step by step
Solved in 2 steps with 1 images

Recommended textbooks for you
Glencoe Algebra 1, Student Edition, 9780079039897…
Algebra
ISBN:
9780079039897
Author:
Carter
Publisher:
McGraw Hill

Holt Mcdougal Larson Pre-algebra: Student Edition…
Algebra
ISBN:
9780547587776
Author:
HOLT MCDOUGAL
Publisher:
HOLT MCDOUGAL

Big Ideas Math A Bridge To Success Algebra 1: Stu…
Algebra
ISBN:
9781680331141
Author:
HOUGHTON MIFFLIN HARCOURT
Publisher:
Houghton Mifflin Harcourt
Glencoe Algebra 1, Student Edition, 9780079039897…
Algebra
ISBN:
9780079039897
Author:
Carter
Publisher:
McGraw Hill
Holt Mcdougal Larson Pre-algebra: Student Edition…
Algebra
ISBN:
9780547587776
Author:
HOLT MCDOUGAL
Publisher:
HOLT MCDOUGAL
Big Ideas Math A Bridge To Success Algebra 1: Stu…
Algebra
ISBN:
9781680331141
Author:
HOUGHTON MIFFLIN HARCOURT
Publisher:
Houghton Mifflin Harcourt