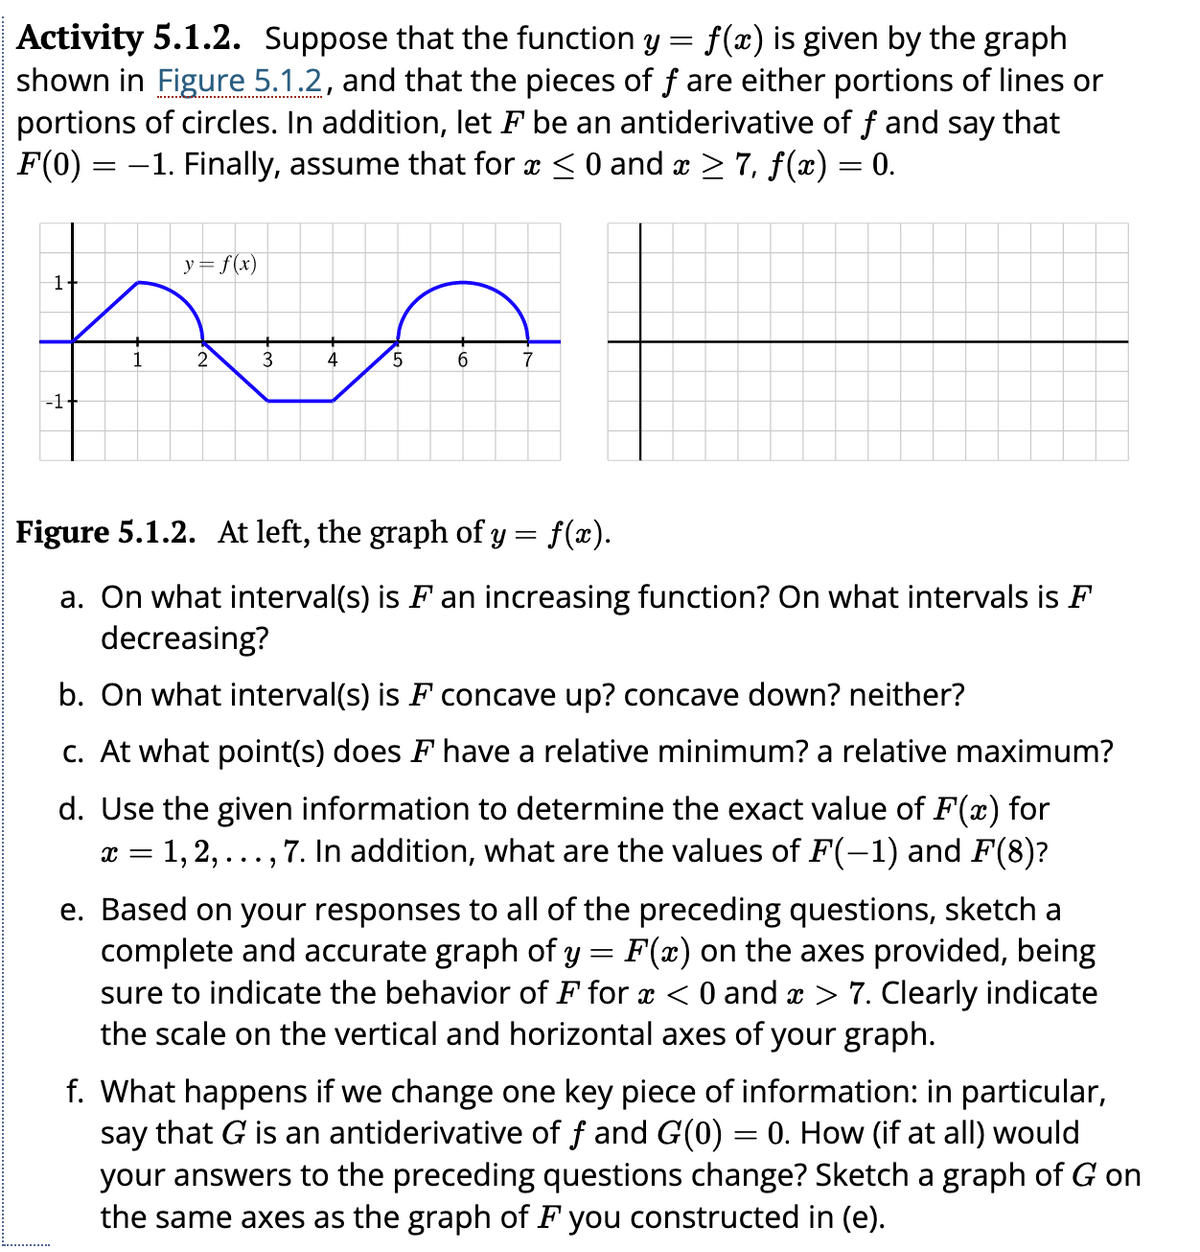
Activity 5.1.2. Suppose that the function y = f(x) is given by the graph shown in Figure 5.1.2, and that the pieces of f are either portions of lines or portions of circles. In addition, let F be an antiderivative of f and say that F(0) = −1. Finally, assume that for x ≤ 0 and x ≥ 7, ƒ(x) = 0. y = f(x) po 1 4 2 3 1 -1 5 6 7 Figure 5.1.2. At left, the graph of y = f(x). a. On what interval(s) is F an increasing function? On what intervals is F decreasing? b. On what interval(s) is F concave up? concave down? neither?
Activity 5.1.2. Suppose that the function y = f(x) is given by the graph shown in Figure 5.1.2, and that the pieces of f are either portions of lines or portions of circles. In addition, let F be an antiderivative of f and say that F(0) = −1. Finally, assume that for x ≤ 0 and x ≥ 7, ƒ(x) = 0. y = f(x) po 1 4 2 3 1 -1 5 6 7 Figure 5.1.2. At left, the graph of y = f(x). a. On what interval(s) is F an increasing function? On what intervals is F decreasing? b. On what interval(s) is F concave up? concave down? neither?

Linear Algebra: A Modern Introduction
4th Edition
ISBN:9781285463247
Author:David Poole
Publisher:David Poole
Chapter6: Vector Spaces
Section6.5: The Kernel And Range Of A Linear Transformation
Problem 30EQ

Related questions
Question
Only need part d answered please, thank you!
Transcribed Image Text:Activity 5.1.2. Suppose that the function y = f(x) is given by the graph
shown in Figure 5.1.2, and that the pieces of f are either portions of lines or
portions of circles. In addition, let F be an antiderivative of f and say that
F(0) = -1. Finally, assume that for x ≤ 0 and x ≥ 7, ƒ(x) = 0.
1
-1+
y = f(x)
2
3
4
5
6
7
Figure 5.1.2. At left, the graph of y = f(x).
a. On what interval(s) is F an increasing function? On what intervals is F
decreasing?
b. On what interval(s) is F concave up? concave down? neither?
c. At what point(s) does F have a relative minimum? a relative maximum?
d. Use the given information to determine the exact value of F(x) for
x = 1, 2, ‚ 7. In addition, what are the values of F(−1) and F(8)?
..
"...
e. Based on your responses to all of the preceding questions, sketch a
complete and accurate graph of y = F(x) on the axes provided, being
sure to indicate the behavior of F for x < 0 and x > 7. Clearly indicate
the scale on the vertical and horizontal axes of your graph.
f. What happens if we change one key piece of information: in particular,
say that G is an antiderivative of ƒ and G(0) = 0. How (if at all) would
your answers to the preceding questions change? Sketch a graph of G on
the same axes as the graph of F you constructed in (e).
Expert Solution
This question has been solved!
Explore an expertly crafted, step-by-step solution for a thorough understanding of key concepts.

This is a popular solution!

Trending now
This is a popular solution!

Step by step
Solved in 2 steps with 2 images

Recommended textbooks for you
Linear Algebra: A Modern Introduction
Algebra
ISBN:
9781285463247
Author:
David Poole
Publisher:
Cengage Learning

Algebra & Trigonometry with Analytic Geometry
Algebra
ISBN:
9781133382119
Author:
Swokowski
Publisher:
Cengage
Linear Algebra: A Modern Introduction
Algebra
ISBN:
9781285463247
Author:
David Poole
Publisher:
Cengage Learning
Algebra & Trigonometry with Analytic Geometry
Algebra
ISBN:
9781133382119
Author:
Swokowski
Publisher:
Cengage