Consider the scenario from the problem above. Let's suppose we are now dealing with an infectious disease that is transmittable via contact with an infected person. As before, define: S number of the people in the population who are susceptible I = number of the people in the population who are infected t = time since outbreak observed, days However, let's assume the following: Each day, .4% of people who are susceptible become infected and 4% of infected people become immune. Each infected person will infect 3 susceptible people per day. Some people who are infected do not become immune, but instead are once again susceptible to getting the disease again - suppose this is 7% of all infected people. Finally, each day 2% of people who are susceptible take a vaccine and so become immune. Remember that all people who are immune are out of the picture of our model. NOTE: You will not be solving this system of differential equations! a.) Draw a diagram similar to that of our "tank" problems that shows the transition rates between the two groups. Though we are not dealing with water and chemicals, we can still think about the "flows" in an analogous way. dS b.) Write a system of differential equation for dd, to model the rate of change of the number of susceptibles and infecteds. dt' dt c.) Find any equilibrium point(s) of this system. Explain what this point(s) mean in the context of the problem. If applicable, you can round to two decimal places (e.g. 213.135 rounds to 213.14). d.) Classify the equilibrium point(s). What does this say about the long-run nature of this disease for the two groups considered?
Consider the scenario from the problem above. Let's suppose we are now dealing with an infectious disease that is transmittable via contact with an infected person. As before, define: S number of the people in the population who are susceptible I = number of the people in the population who are infected t = time since outbreak observed, days However, let's assume the following: Each day, .4% of people who are susceptible become infected and 4% of infected people become immune. Each infected person will infect 3 susceptible people per day. Some people who are infected do not become immune, but instead are once again susceptible to getting the disease again - suppose this is 7% of all infected people. Finally, each day 2% of people who are susceptible take a vaccine and so become immune. Remember that all people who are immune are out of the picture of our model. NOTE: You will not be solving this system of differential equations! a.) Draw a diagram similar to that of our "tank" problems that shows the transition rates between the two groups. Though we are not dealing with water and chemicals, we can still think about the "flows" in an analogous way. dS b.) Write a system of differential equation for dd, to model the rate of change of the number of susceptibles and infecteds. dt' dt c.) Find any equilibrium point(s) of this system. Explain what this point(s) mean in the context of the problem. If applicable, you can round to two decimal places (e.g. 213.135 rounds to 213.14). d.) Classify the equilibrium point(s). What does this say about the long-run nature of this disease for the two groups considered?

Algebra & Trigonometry with Analytic Geometry
13th Edition
ISBN:9781133382119
Author:Swokowski
Publisher:Swokowski
Chapter5: Inverse, Exponential, And Logarithmic Functions
Section5.6: Exponential And Logarithmic Equations
Problem 64E

Related questions
Question
only part d please!
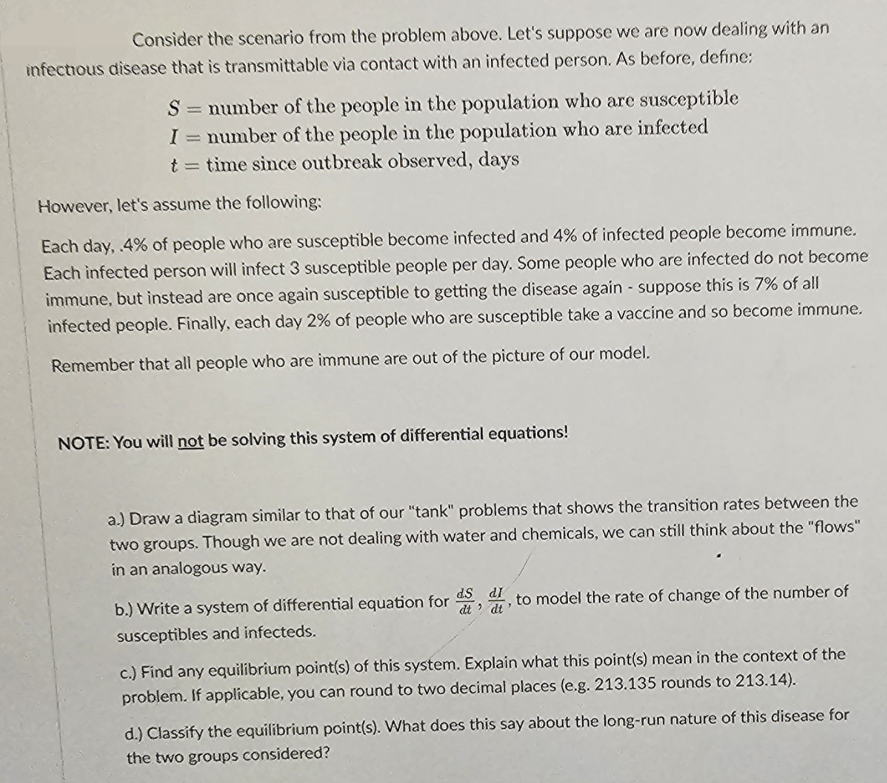
Transcribed Image Text:Consider the scenario from the problem above. Let's suppose we are now dealing with an
infectious disease that is transmittable via contact with an infected person. As before, define:
S number of the people in the population who are susceptible
I = number of the people in the population who are infected
t = time since outbreak observed, days
However, let's assume the following:
Each day, .4% of people who are susceptible become infected and 4% of infected people become immune.
Each infected person will infect 3 susceptible people per day. Some people who are infected do not become
immune, but instead are once again susceptible to getting the disease again - suppose this is 7% of all
infected people. Finally, each day 2% of people who are susceptible take a vaccine and so become immune.
Remember that all people who are immune are out of the picture of our model.
NOTE: You will not be solving this system of differential equations!
a.) Draw a diagram similar to that of our "tank" problems that shows the transition rates between the
two groups. Though we are not dealing with water and chemicals, we can still think about the "flows"
in an analogous way.
dS
b.) Write a system of differential equation for dd, to model the rate of change of the number of
susceptibles and infecteds.
dt' dt
c.) Find any equilibrium point(s) of this system. Explain what this point(s) mean in the context of the
problem. If applicable, you can round to two decimal places (e.g. 213.135 rounds to 213.14).
d.) Classify the equilibrium point(s). What does this say about the long-run nature of this disease for
the two groups considered?
Expert Solution
This question has been solved!
Explore an expertly crafted, step-by-step solution for a thorough understanding of key concepts.

Step by step
Solved in 5 steps with 3 images

Follow-up Questions
Read through expert solutions to related follow-up questions below.
Recommended textbooks for you
Algebra & Trigonometry with Analytic Geometry
Algebra
ISBN:
9781133382119
Author:
Swokowski
Publisher:
Cengage

Glencoe Algebra 1, Student Edition, 9780079039897…
Algebra
ISBN:
9780079039897
Author:
Carter
Publisher:
McGraw Hill

Trigonometry (MindTap Course List)
Trigonometry
ISBN:
9781337278461
Author:
Ron Larson
Publisher:
Cengage Learning
Algebra & Trigonometry with Analytic Geometry
Algebra
ISBN:
9781133382119
Author:
Swokowski
Publisher:
Cengage
Glencoe Algebra 1, Student Edition, 9780079039897…
Algebra
ISBN:
9780079039897
Author:
Carter
Publisher:
McGraw Hill
Trigonometry (MindTap Course List)
Trigonometry
ISBN:
9781337278461
Author:
Ron Larson
Publisher:
Cengage Learning