The amount of time (minutes) a sample of students spent on online social media in a 4-hour window is organized in a frequency distribution with 7 class intervals. The class intervals are 0 to < 10, 10 to 20, ..., 60 to < 70. The number of observations (frequencies) for the classes are 3, 10, 17, 13, 15, 11, and 5 respectively. a. Complete the following frequency table for the distribution showing frequency, relative frequency, cumulative frequency, and cumulative relative frequencies. Round to four decimal places when necessary Relative Class Interval Frequency Frequency 0 to < 10 10 to < 20 20 to < 30 30 to < 40 40 to 50 50 to 60 60 to < 70 % Round to two decimal places Cumulative Frequency b. How many students spent between 40 and 60 minutes on social media? Cumulative Relative c. What percent of the students spent between 50 and 60 minutes on social media? % Round to two decimal places Frequency d. What percent of the students spent no more than 40 minutes on social media? % Round to two decimal places e. What percent of the students spent no less than 50 minutes on social media?
The amount of time (minutes) a sample of students spent on online social media in a 4-hour window is organized in a frequency distribution with 7 class intervals. The class intervals are 0 to < 10, 10 to 20, ..., 60 to < 70. The number of observations (frequencies) for the classes are 3, 10, 17, 13, 15, 11, and 5 respectively. a. Complete the following frequency table for the distribution showing frequency, relative frequency, cumulative frequency, and cumulative relative frequencies. Round to four decimal places when necessary Relative Class Interval Frequency Frequency 0 to < 10 10 to < 20 20 to < 30 30 to < 40 40 to 50 50 to 60 60 to < 70 % Round to two decimal places Cumulative Frequency b. How many students spent between 40 and 60 minutes on social media? Cumulative Relative c. What percent of the students spent between 50 and 60 minutes on social media? % Round to two decimal places Frequency d. What percent of the students spent no more than 40 minutes on social media? % Round to two decimal places e. What percent of the students spent no less than 50 minutes on social media?

Glencoe Algebra 1, Student Edition, 9780079039897, 0079039898, 2018
18th Edition
ISBN:9780079039897
Author:Carter
Publisher:Carter
Chapter10: Statistics
Section10.4: Distributions Of Data
Problem 19PFA

Related questions
Question
100%
answer all if you want upvote
if not only answer the last three letters
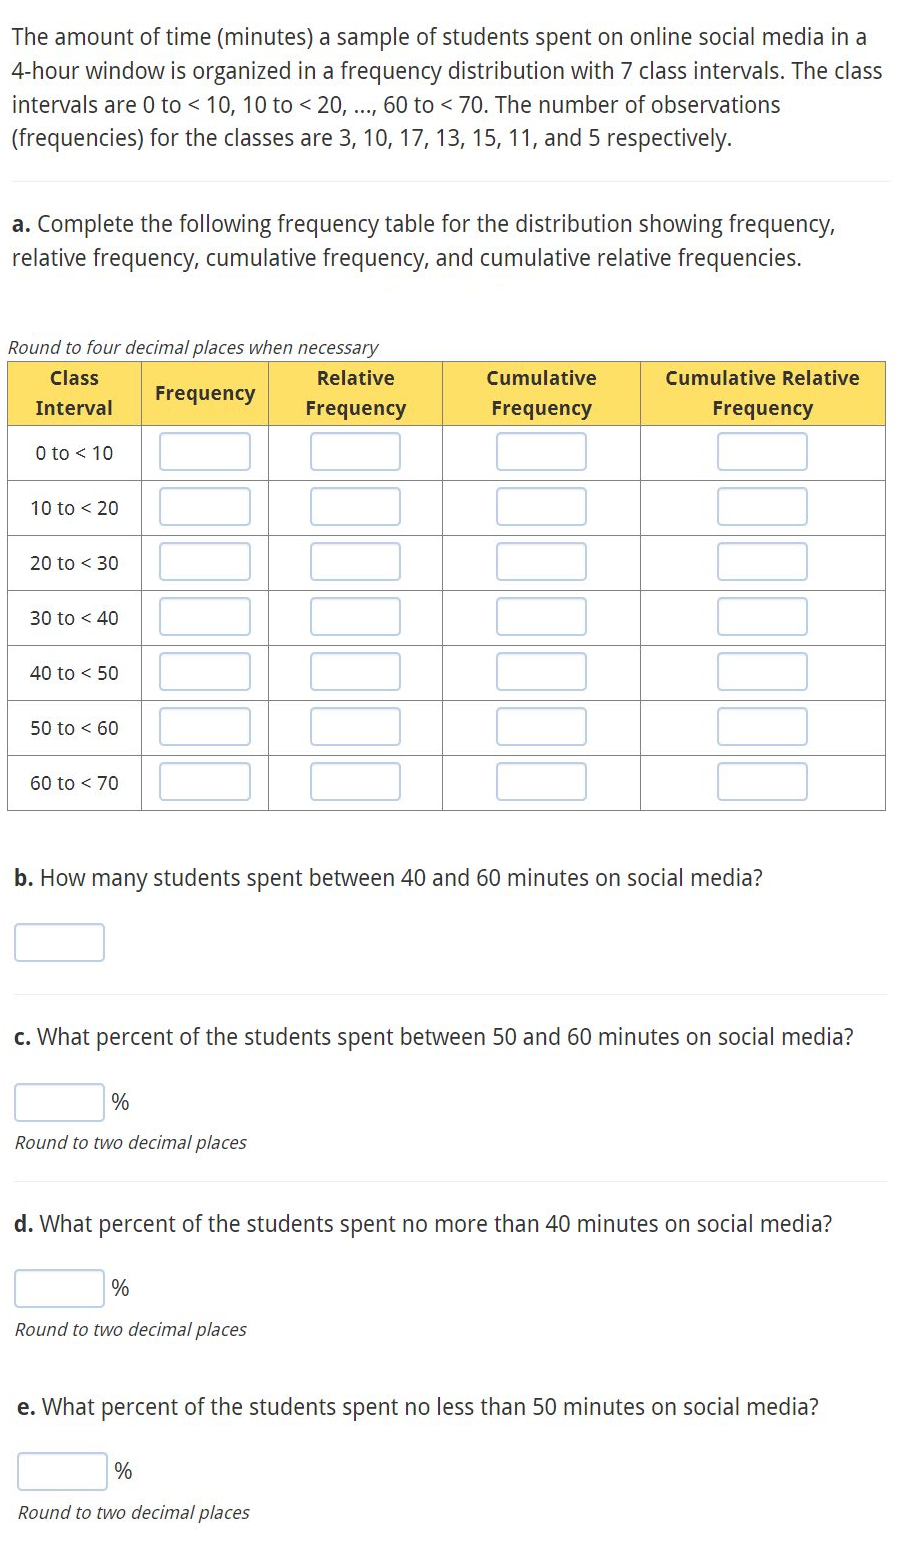
Transcribed Image Text:The amount of time (minutes) a sample of students spent on online social media in a
4-hour window is organized in a frequency distribution with 7 class intervals. The class
intervals are 0 to < 10, 10 to 20, ..., 60 to < 70. The number of observations
(frequencies) for the classes are 3, 10, 17, 13, 15, 11, and 5 respectively.
a. Complete the following frequency table for the distribution showing frequency,
relative frequency, cumulative frequency, and cumulative relative frequencies.
Round to four decimal places when necessary
Relative
Class
Interval
Frequency
Frequency
0 to < 10
10 to < 20
20 to < 30
30 to < 40
40 to 50
50 to 60
60 to < 70
%
Round to two decimal places
Cumulative
Frequency
b. How many students spent between 40 and 60 minutes on social media?
Cumulative Relative
c. What percent of the students spent between 50 and 60 minutes on social media?
%
Round to two decimal places
Frequency
d. What percent of the students spent no more than 40 minutes on social media?
%
Round to two decimal places
e. What percent of the students spent no less than 50 minutes on social media?
Expert Solution
This question has been solved!
Explore an expertly crafted, step-by-step solution for a thorough understanding of key concepts.

Step by step
Solved in 2 steps with 2 images

Recommended textbooks for you
Glencoe Algebra 1, Student Edition, 9780079039897…
Algebra
ISBN:
9780079039897
Author:
Carter
Publisher:
McGraw Hill
Glencoe Algebra 1, Student Edition, 9780079039897…
Algebra
ISBN:
9780079039897
Author:
Carter
Publisher:
McGraw Hill