
Chapter3: Tools For Exploring The World: Physical, Perceptual, And Motor Development
Section3.2: Physical Development
Problem 3TY

Related questions
Question
100%
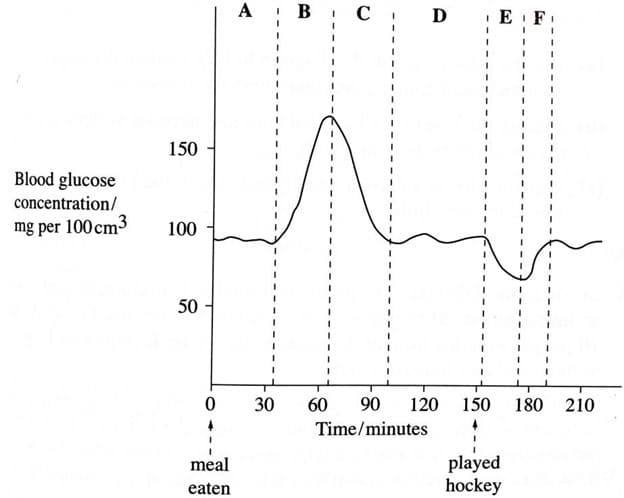
The graph in Figure 4 shows changes in blood glucose concentration after a meal.
FIGURE 4
(a)Explain with respect to specific hormones, the changes in glucose concentration in EACH of the stages A to F. Clearly identify each stage.
Transcribed Image Text:A B
C
D
E
150
Blood glucose
concentration/
mg per 100cm3
100
50
30
60
90
120
150 180 210
Time/minutes
played
hockey
meal
eaten
Expert Solution
This question has been solved!
Explore an expertly crafted, step-by-step solution for a thorough understanding of key concepts.

Step by step
Solved in 2 steps

Knowledge Booster


Learn more about
Need a deep-dive on the concept behind this application? Look no further. Learn more about this topic, biology and related others by exploring similar questions and additional content below.Recommended textbooks for you

Human Physiology: From Cells to Systems (MindTap …
Biology
ISBN:
9781285866932
Author:
Lauralee Sherwood
Publisher:
Cengage Learning
Essentials of Pharmacology for Health Professions
Nursing
ISBN:
9781305441620
Author:
WOODROW
Publisher:
Cengage
Human Physiology: From Cells to Systems (MindTap …
Biology
ISBN:
9781285866932
Author:
Lauralee Sherwood
Publisher:
Cengage Learning
Essentials of Pharmacology for Health Professions
Nursing
ISBN:
9781305441620
Author:
WOODROW
Publisher:
Cengage

Comprehensive Medical Assisting: Administrative a…
Nursing
ISBN:
9781305964792
Author:
Wilburta Q. Lindh, Carol D. Tamparo, Barbara M. Dahl, Julie Morris, Cindy Correa
Publisher:
Cengage Learning