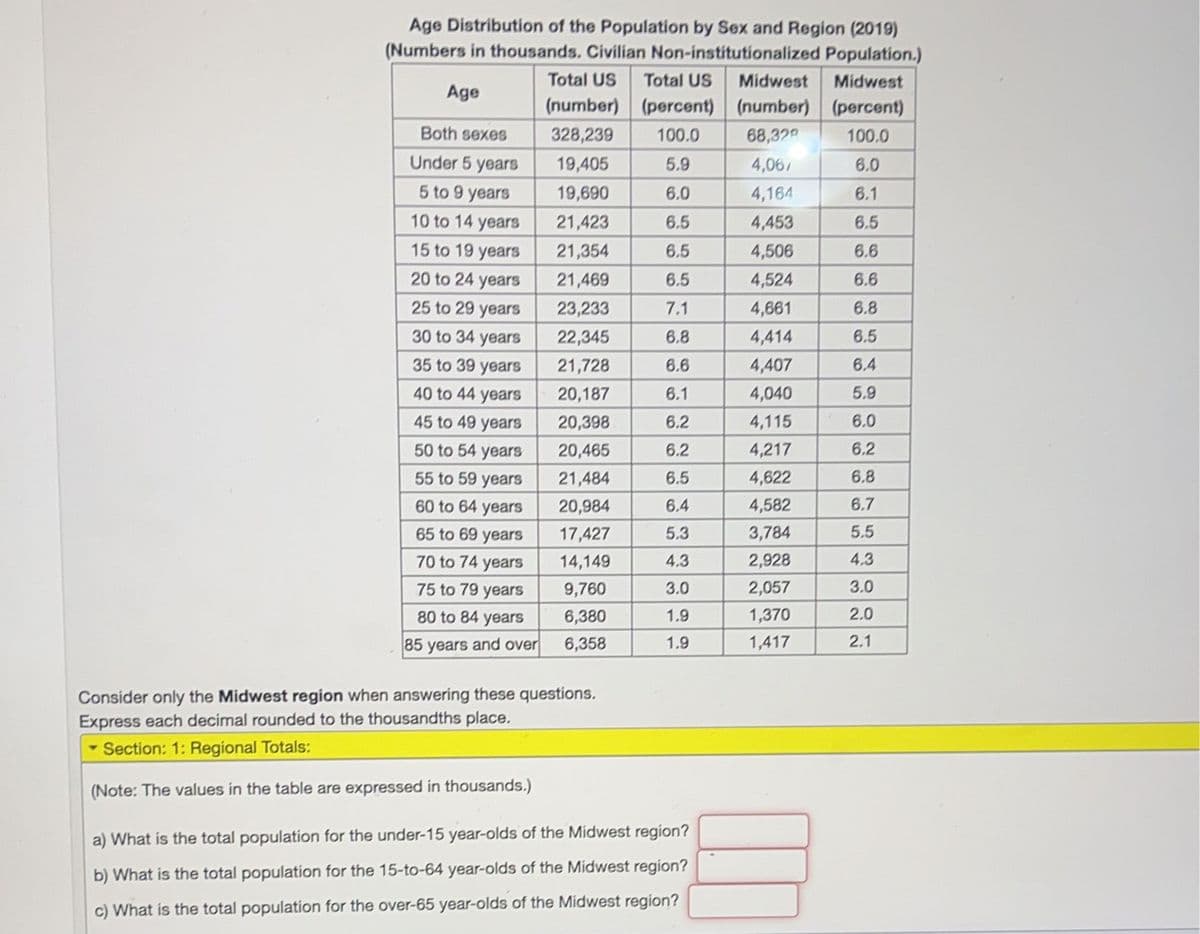
Age Distribution of the Population by Sex and Region (2019) (Numbers in thousands. Civilian Non-institutionalized Population.) Total US Total US Midwest Midwest Age (number) (percent) (number) (percent) Both sexes 328,239 100.0 68,320 100.0 Under 5 years 19,405 5.9 4,067 6.0 5 to 9 years 19,690 6.0 4,164 6.1 10 to 14 years 21,423 6.5 4,453 6.5 15 to 19 years 21,354 6.5 4,506 6.6 20 to 24 years 21,469 6.5 4,524 6.6 25 to 29 years 23,233 7.1 4,661 6.8 30 to 34 years 22,345 6.8 4,414 6.5 35 to 39 years 21,728 6.6 4,407 6.4 40 to 44 years 20,187 6.1 4,040 5.9 45 to 49 years 20,398 6.2 4,115 6.0 50 to 54 years 20,465 6.2 4,217 6.2 55 to 59 years 21,484 6.5 4,622 6.8 60 to 64 years 20,984 6.4 4,582 6.7 65 to 69 years 17,427 5.3 3,784 5.5 70 to 74 years 14,149 4.3 2,928 4.3 75 to 79 years 9,760 3.0 2,057 3.0 80 to 84 years 6,380 1.9 1,370 2.0 85 years and over 6,358 1.9 1,417 2.1 Consider only the Midwest region when answering these questions. Express each decimal rounded to the thousandths place. - Section: 1: Regional Totals: (Note: The values in the table are expressed in thousands.) a) What is the total population for the under-15 year-olds of the Midwest region? b) What is the total population for the 15-to-64 year-olds of the Midwest region? c) What is the total population for the over-65 year-olds of the Midwest region?
Age Distribution of the Population by Sex and Region (2019) (Numbers in thousands. Civilian Non-institutionalized Population.) Total US Total US Midwest Midwest Age (number) (percent) (number) (percent) Both sexes 328,239 100.0 68,320 100.0 Under 5 years 19,405 5.9 4,067 6.0 5 to 9 years 19,690 6.0 4,164 6.1 10 to 14 years 21,423 6.5 4,453 6.5 15 to 19 years 21,354 6.5 4,506 6.6 20 to 24 years 21,469 6.5 4,524 6.6 25 to 29 years 23,233 7.1 4,661 6.8 30 to 34 years 22,345 6.8 4,414 6.5 35 to 39 years 21,728 6.6 4,407 6.4 40 to 44 years 20,187 6.1 4,040 5.9 45 to 49 years 20,398 6.2 4,115 6.0 50 to 54 years 20,465 6.2 4,217 6.2 55 to 59 years 21,484 6.5 4,622 6.8 60 to 64 years 20,984 6.4 4,582 6.7 65 to 69 years 17,427 5.3 3,784 5.5 70 to 74 years 14,149 4.3 2,928 4.3 75 to 79 years 9,760 3.0 2,057 3.0 80 to 84 years 6,380 1.9 1,370 2.0 85 years and over 6,358 1.9 1,417 2.1 Consider only the Midwest region when answering these questions. Express each decimal rounded to the thousandths place. - Section: 1: Regional Totals: (Note: The values in the table are expressed in thousands.) a) What is the total population for the under-15 year-olds of the Midwest region? b) What is the total population for the 15-to-64 year-olds of the Midwest region? c) What is the total population for the over-65 year-olds of the Midwest region?

Glencoe Algebra 1, Student Edition, 9780079039897, 0079039898, 2018
18th Edition
ISBN:9780079039897
Author:Carter
Publisher:Carter
Chapter10: Statistics
Section10.6: Summarizing Categorical Data
Problem 35PPS

Related questions
Question
Need help understanding what to add together for parts a,b,c. I can’t figure out the decimals
Transcribed Image Text:Age Distribution of the Population by Sex and Region (2019)
(Numbers in thousands. Civilian Non-institutionalized Population.)
Total US
Total US
Midwest
Midwest
Age
(number) (percent) (number) (percent)
Both sexes
328,239
100.0
68,329
100.0
Under 5 years
5 to 9 years
10 to 14 years
15 to 19 years
20 to 24 years
19,405
5.9
4,067
6.0
19,690
6.0
4,164
6.1
21,423
6.5
4,453
6.5
21,354
6.5
4,506
6.6
21,469
6.5
4,524
6.6
25 to 29 years
23,233
7.1
4,661
6.8
30 to 34 years
22,345
6.8
4,414
6.5
35 to 39 years
21,728
6.6
4,407
6.4
40 to 44 years
45 to 49 years
50 to 54 years
55 to 59 years
20,187
6.1
4,040
5.9
20,398
6.2
4,115
6.0
20,465
6.2
4,217
6.2
21,484
6.5
4,622
6.8
60 to 64 years
20,984
6.4
4,582
6.7
3,784
5.5
65 to 69 years
70 to 74 years
75 to 79 years
80 to 84 years
85 years and over
17,427
5.3
14,149
4.3
2,928
4.3
9,760
3.0
2,057
3.0
6,380
1.9
1,370
2.0
6,358
1.9
1,417
2.1
Consider only the Midwest region when answering these questions.
Express each decimal rounded to the thousandths place.
- Section: 1: Regional Totals:
(Note: The values in the table are expressed in thousands.)
a) What is the total population for the under-15 year-olds of the Midwest region?
b) What is the total population for the 15-to-64 year-olds of the Midwest region?
c) What is the total population for the over-65 year-olds of the Midwest region?
Expert Solution
This question has been solved!
Explore an expertly crafted, step-by-step solution for a thorough understanding of key concepts.

This is a popular solution!

Trending now
This is a popular solution!

Step by step
Solved in 4 steps with 4 images

Recommended textbooks for you
Glencoe Algebra 1, Student Edition, 9780079039897…
Algebra
ISBN:
9780079039897
Author:
Carter
Publisher:
McGraw Hill

Big Ideas Math A Bridge To Success Algebra 1: Stu…
Algebra
ISBN:
9781680331141
Author:
HOUGHTON MIFFLIN HARCOURT
Publisher:
Houghton Mifflin Harcourt

Linear Algebra: A Modern Introduction
Algebra
ISBN:
9781285463247
Author:
David Poole
Publisher:
Cengage Learning
Glencoe Algebra 1, Student Edition, 9780079039897…
Algebra
ISBN:
9780079039897
Author:
Carter
Publisher:
McGraw Hill
Big Ideas Math A Bridge To Success Algebra 1: Stu…
Algebra
ISBN:
9781680331141
Author:
HOUGHTON MIFFLIN HARCOURT
Publisher:
Houghton Mifflin Harcourt
Linear Algebra: A Modern Introduction
Algebra
ISBN:
9781285463247
Author:
David Poole
Publisher:
Cengage Learning

Functions and Change: A Modeling Approach to Coll…
Algebra
ISBN:
9781337111348
Author:
Bruce Crauder, Benny Evans, Alan Noell
Publisher:
Cengage Learning