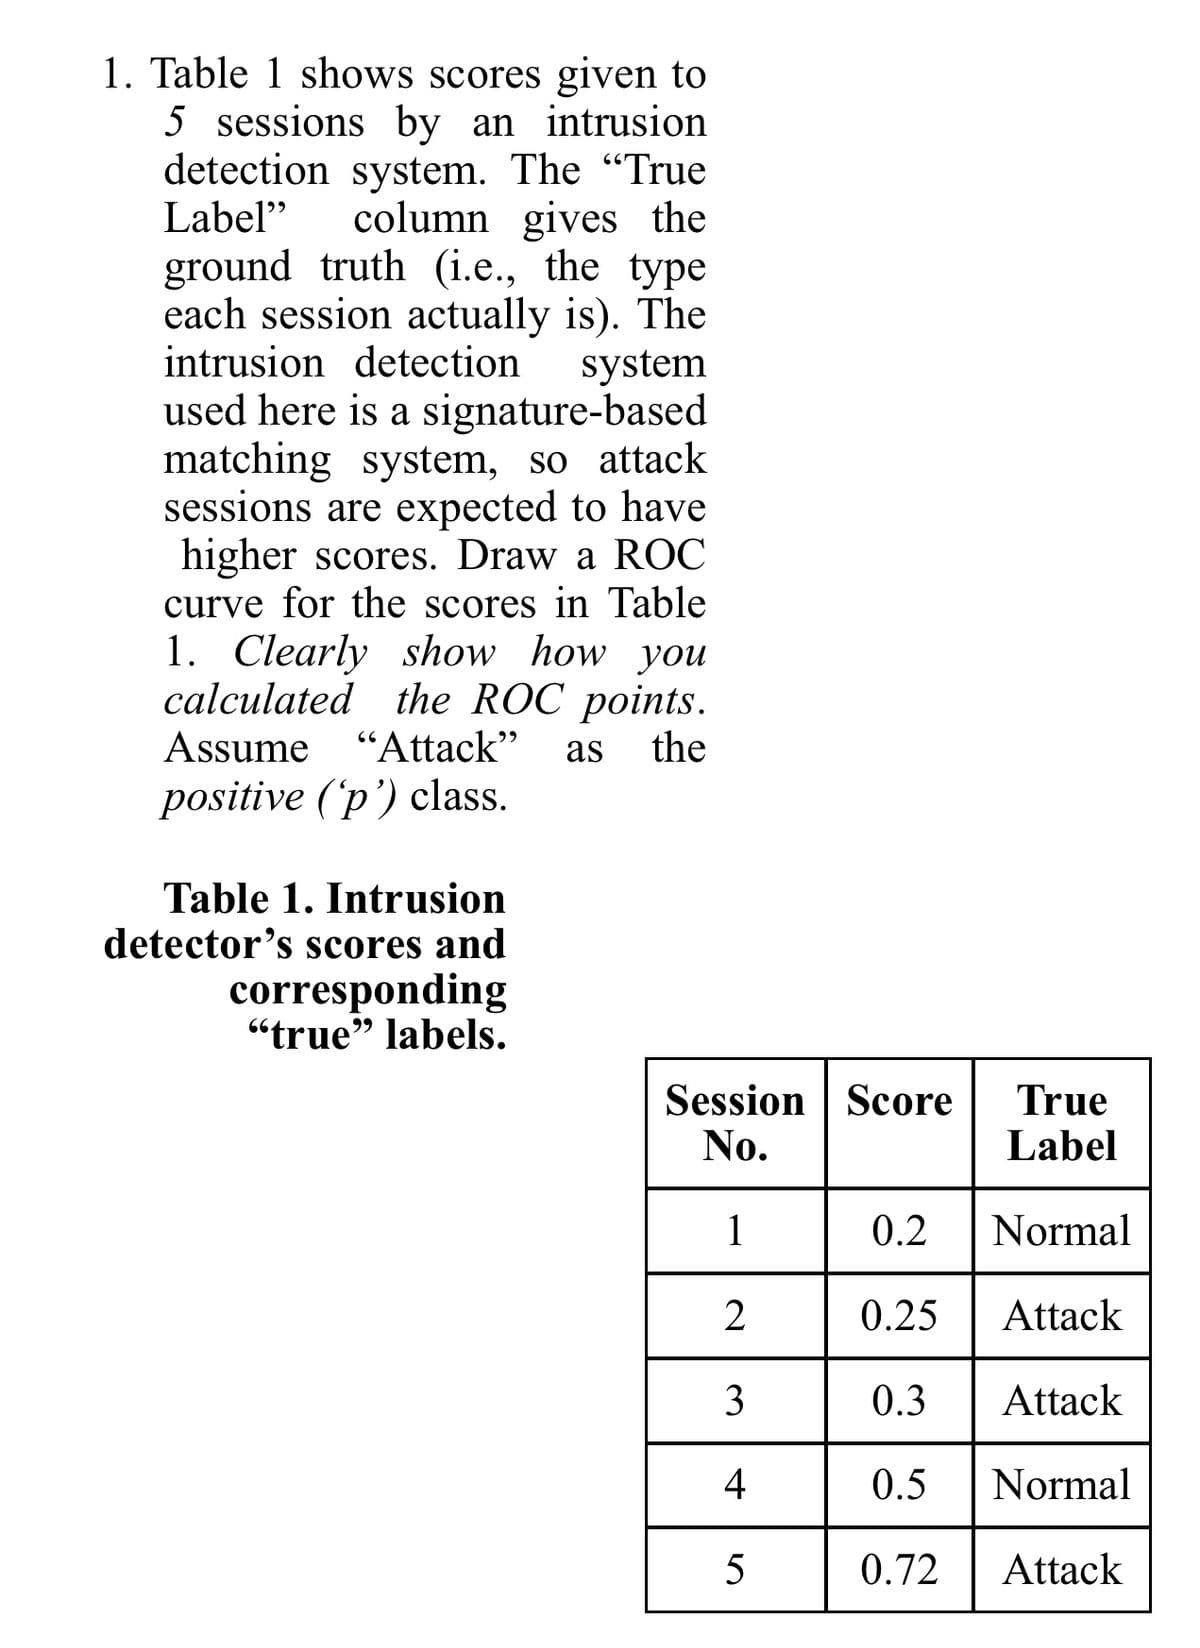
1. Table 1 shows scores given to 5 sessions by an intrusion detection system. The "True Label" column gives the ground truth (i.e., the type each session actually is). The intrusion detection used here is a signature-based matching system, so attack sessions are expected to have higher scores. Draw a ROC curve for the scores in Table 1. Clearly show how you calculated the ROC points. system Assume "Attack" as the positive ('p') class. Table 1. Intrusion detector's scores and corresponding “true" labels. 99 Session Score No. True Label 1 0.2 Normal 2 0.25 Attack 3 0.3 Attack 4 0.5 Normal 5 0.72 Attack
1. Table 1 shows scores given to 5 sessions by an intrusion detection system. The "True Label" column gives the ground truth (i.e., the type each session actually is). The intrusion detection used here is a signature-based matching system, so attack sessions are expected to have higher scores. Draw a ROC curve for the scores in Table 1. Clearly show how you calculated the ROC points. system Assume "Attack" as the positive ('p') class. Table 1. Intrusion detector's scores and corresponding “true" labels. 99 Session Score No. True Label 1 0.2 Normal 2 0.25 Attack 3 0.3 Attack 4 0.5 Normal 5 0.72 Attack

Related questions
Question
1
Transcribed Image Text:1. Table 1 shows scores given to
5 sessions by an intrusion
detection system. The "True
Label"
column gives the
ground truth (i.e., the type
each session actually is). The
intrusion detection
used here is a signature-based
matching system, so attack
sessions are expected to have
higher scores. Draw a ROC
curve for the scores in Table
1. Clearly show how you
calculated the ROC points.
system
Assume "Attack"
as
the
positive ('p') class.
Table 1. Intrusion
detector's scores and
corresponding
“true" labels.
99
Session Score
No.
True
Label
1
0.2
Normal
2
0.25
Attack
3
0.3
Attack
4
0.5
Normal
5
0.72
Attack
Expert Solution
This question has been solved!
Explore an expertly crafted, step-by-step solution for a thorough understanding of key concepts.

Step by step
Solved in 3 steps with 1 images
