alculate ratios related to how quickly the company pays its trade debt and how quickly it collects from its customers. These are known as Accounts Payable (AP) Turnover and Accounts Receivable (AR) Turnover. The formula for AP Turnover is: Cost of Goods Sold/average accounts payable. The formula for AR Turnover is: credit sales/average accounts receivable. Calculate the AP and AR Turnover for each of 2011-2014. Interpret your calculations: what does this information mean? How is the company doing?
alculate ratios related to how quickly the company pays its trade debt and how quickly it collects from its customers. These are known as Accounts Payable (AP) Turnover and Accounts Receivable (AR) Turnover. The formula for AP Turnover is: Cost of Goods Sold/average accounts payable. The formula for AR Turnover is: credit sales/average accounts receivable. Calculate the AP and AR Turnover for each of 2011-2014. Interpret your calculations: what does this information mean? How is the company doing?

Fundamentals of Financial Management (MindTap Course List)
15th Edition
ISBN:9781337395250
Author:Eugene F. Brigham, Joel F. Houston
Publisher:Eugene F. Brigham, Joel F. Houston
Chapter4: Analysis Of Financial Statements
Section: Chapter Questions
Problem 24P: Income Statement for Year Ended December 31, 2018 (Millions of Dollars) Net sales 795.0 Cost of...

Related questions
Question
100%
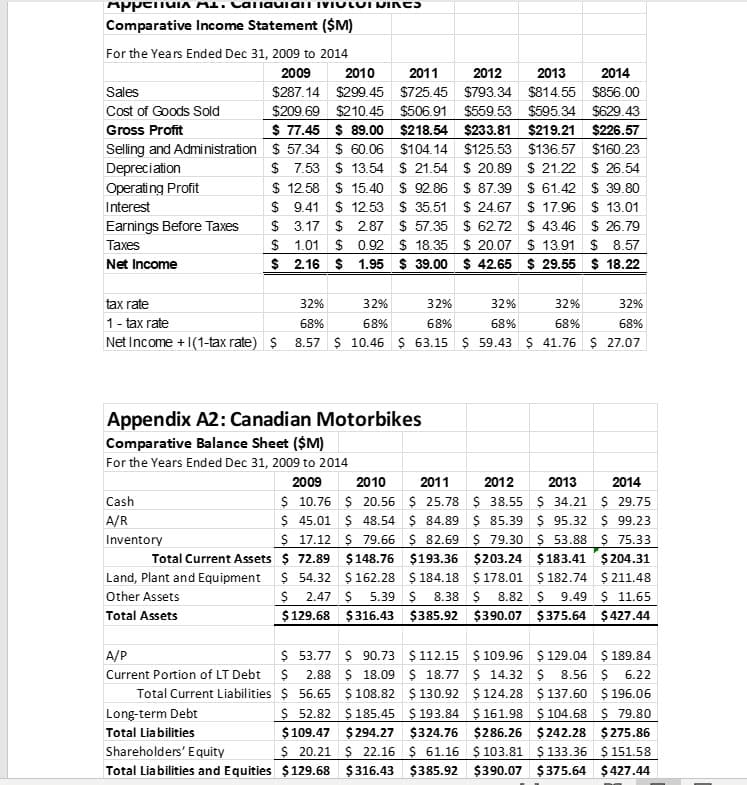
- Calculate ratios related to how quickly the company pays its trade debt and how quickly it collects from its customers. These are known as Accounts Payable (AP) Turnover and Accounts Receivable (AR) Turnover. The formula for AP Turnover is: Cost of Goods Sold/average accounts payable. The formula for AR Turnover is: credit sales/average accounts receivable. Calculate the AP and AR Turnover for each of 2011-2014. Interpret your calculations: what does this information mean? How is the company doing?
Transcribed Image Text:ANNETILIA ML. ναιιανιαιινιωιωι WINES
Comparative Income Statement ($M)
For the Years Ended Dec 31, 2009 to 2014
Sales
Cost of Goods Sold
Gross Profit
Selling and Administration
Depreciation
Operating Profit
Interest
Earnings Before Taxes
Taxes
Net Income
2011
2012
2013
2014
$725.45 $793.34 $814.55
$856.00
2009 2010
$287.14 $299.45
$209.69 $210.45 $506.91 $559.53 $595.34 $629.43
$ 77.45 $ 89.00 $218.54 $233.81 $219.21 $226.57
$ 57.34 $60.06 $104.14 $125.53 $136.57 $160.23
$7.53 $13.54 $21.54 $ 20.89 $21.22 $26.54
$ 12.58 $15.40 $ 92.86 $ 87.39 $61.42 $ 39.80
$9.41 $ 12.53 $35.51 $24.67 $17.96 $13.01
$ 3.17 $2.87 $57.35 $ 62.72 $ 43.46 $26.79
1.01 $0.92 $18.35 $20.07 $13.91 $ 8.57
$ 2.16 $ 1.95 $39.00 $42.65 $29.55 $18.22
$
tax rate
32%
1 - tax rate
68%
Net Income +1(1-tax rate) $ 8.57
Cash
A/R
Inventory
Appendix A2: Canadian Motorbikes
Comparative Balance Sheet ($M)
For the Years Ended Dec 31, 2009 to 2014
2009
Total Current Assets
Land, Plant and Equipment
Other Assets
Total Assets
32%
68%
$10.46 $ 63.15
A/P
Current Portion of LT Debt
Total Current Liabilities
Long-term Debt
Total Liabilities
Shareholders' Equity
Total Liabilities and Equities
32%
68%
32%
32%
32%
68%
68%
68%
$59.43 $ 41.76 $ 27.07
2011
2014
2010
2012 2013
$ 10.76 $ 20.56 $ 25.78 $ 38.55 $ 34.21 $ 29.75
$ 45.01 $ 48.54 $ 84.89 $ 85.39 $ 95.32 $ 99.23
$ 17.12 $79.66 $ 82.69 $ 79.30 $ 53.88 $ 75.33
$72.89 $148.76 $193.36 $203.24 $183.41 $204.31
$ 54.32 $ 162.28 $184.18 $ 178.01 $ 182.74 $211.48
$ 2.47 $ 5.39 $ 8.38 $ 8.82 $9.49 $ 11.65
$129.68 $316.43 $385.92 $390.07 $375.64 $427.44
$ 53.77 $ 90.73 $112.15 $109.96 $129.04 $189.84
$ 2.88 $ 18.09 $ 18.77 $ 14.32 $ 8.56 $ 6.22
$ 52.82 $185.45 $193.84 $161.98
$109.47 $294.27 $324.76 $286.26
$ 20.21 $ 22.16 $ 61.16 $ 103.81
$129.68 $316.43 $385.92 $390.07
$ 56.65 $108.82 $130.92 $124.28 $137.60 $ 196.06
$104.68 $ 79.80
$242.28 $275.86
$ 133.36 $ 151.58
$375.64 $427.44
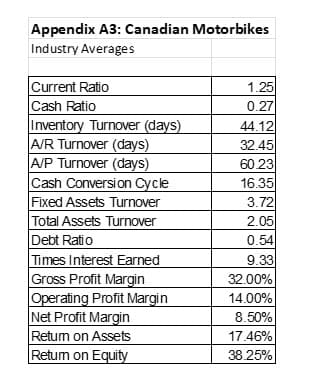
Transcribed Image Text:Appendix A3: Canadian Motorbikes
Industry Averages
Current Ratio
Cash Ratio
Inventory Turnover (days)
A/R Turnover (days)
A/P Turnover (days)
Cash Conversion Cycle
Fixed Assets Turnover
Total Assets Turnover
Debt Ratio
Times Interest Earned
Gross Profit Margin
Operating Profit Margin
Net Profit Margin
Retum on Assets
Retum on Equity
1.25
0.27
44.12
32.45
60.23
16.35
3.72
2.05
0.54
9.33
32.00%
14.00%
8.50%
17.46%
38.25%
Expert Solution
This question has been solved!
Explore an expertly crafted, step-by-step solution for a thorough understanding of key concepts.

Step by step
Solved in 4 steps

Knowledge Booster


Learn more about
Need a deep-dive on the concept behind this application? Look no further. Learn more about this topic, accounting and related others by exploring similar questions and additional content below.Recommended textbooks for you
Fundamentals of Financial Management (MindTap Cou…
Finance
ISBN:
9781337395250
Author:
Eugene F. Brigham, Joel F. Houston
Publisher:
Cengage Learning

Financial Reporting, Financial Statement Analysis…
Finance
ISBN:
9781285190907
Author:
James M. Wahlen, Stephen P. Baginski, Mark Bradshaw
Publisher:
Cengage Learning

Intermediate Accounting: Reporting And Analysis
Accounting
ISBN:
9781337788281
Author:
James M. Wahlen, Jefferson P. Jones, Donald Pagach
Publisher:
Cengage Learning
Fundamentals of Financial Management (MindTap Cou…
Finance
ISBN:
9781337395250
Author:
Eugene F. Brigham, Joel F. Houston
Publisher:
Cengage Learning
Financial Reporting, Financial Statement Analysis…
Finance
ISBN:
9781285190907
Author:
James M. Wahlen, Stephen P. Baginski, Mark Bradshaw
Publisher:
Cengage Learning
Intermediate Accounting: Reporting And Analysis
Accounting
ISBN:
9781337788281
Author:
James M. Wahlen, Jefferson P. Jones, Donald Pagach
Publisher:
Cengage Learning

Cornerstones of Financial Accounting
Accounting
ISBN:
9781337690881
Author:
Jay Rich, Jeff Jones
Publisher:
Cengage Learning

Survey of Accounting (Accounting I)
Accounting
ISBN:
9781305961883
Author:
Carl Warren
Publisher:
Cengage Learning