2. The graph shows the average monthly temperature, in degrees Celsius, for Thompson, MB. The data can be modeled by an equation of the form y=acosb(x-c)+d. The minimum and maximum values are at y=-25 and y=15, respectively. 30 20 10 10 12 10 -20- Determine the equation represented by this graph. Recall that when the directing word "determine" is used, steps need to be shown and/or explained. Show a calculation or explain your process for finding each value a, b, c & d.
2. The graph shows the average monthly temperature, in degrees Celsius, for Thompson, MB. The data can be modeled by an equation of the form y=acosb(x-c)+d. The minimum and maximum values are at y=-25 and y=15, respectively. 30 20 10 10 12 10 -20- Determine the equation represented by this graph. Recall that when the directing word "determine" is used, steps need to be shown and/or explained. Show a calculation or explain your process for finding each value a, b, c & d.

Glencoe Algebra 1, Student Edition, 9780079039897, 0079039898, 2018
18th Edition
ISBN:9780079039897
Author:Carter
Publisher:Carter
Chapter9: Quadratic Functions And Equations
Section9.2: Transformations Of Quadratic Functions
Problem 42HP

Related questions
Question
solve the question with complete and correct explanation within 15 mins or else downvote
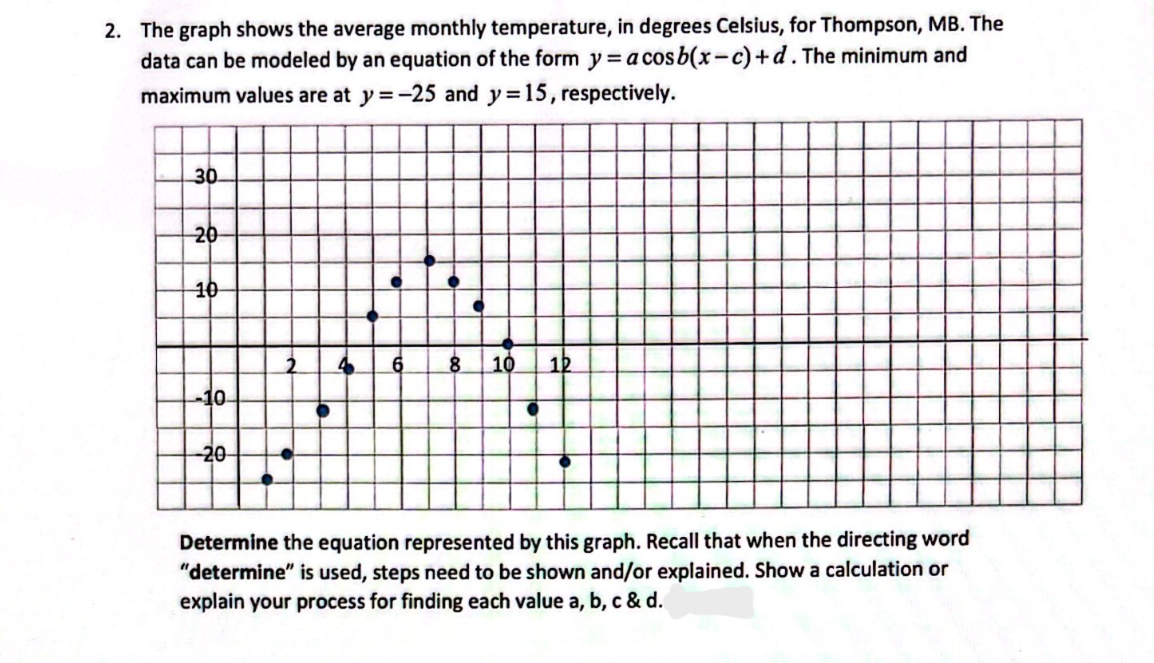
Transcribed Image Text:2. The graph shows the average monthly temperature, in degrees Celsius, for Thompson, MB. The
data can be modeled by an equation of the form y=acosb(x-c)+d. The minimum and
maximum values are at y=-25 and y=15, respectively.
30
20
10
10
12
10
-20-
Determine the equation represented by this graph. Recall that when the directing word
"determine" is used, steps need to be shown and/or explained. Show a calculation or
explain your process for finding each value a, b, c & d.
Expert Solution
This question has been solved!
Explore an expertly crafted, step-by-step solution for a thorough understanding of key concepts.

This is a popular solution!

Trending now
This is a popular solution!

Step by step
Solved in 2 steps

Recommended textbooks for you
Glencoe Algebra 1, Student Edition, 9780079039897…
Algebra
ISBN:
9780079039897
Author:
Carter
Publisher:
McGraw Hill

Algebra & Trigonometry with Analytic Geometry
Algebra
ISBN:
9781133382119
Author:
Swokowski
Publisher:
Cengage
Glencoe Algebra 1, Student Edition, 9780079039897…
Algebra
ISBN:
9780079039897
Author:
Carter
Publisher:
McGraw Hill
Algebra & Trigonometry with Analytic Geometry
Algebra
ISBN:
9781133382119
Author:
Swokowski
Publisher:
Cengage