b Math for X bra Week ook S d C $ www K 78 99 120 135 153 168 172 + % 5 6 What does the x-intercept on the graph of y = T(X) represent? c. Solve part (a) symbolically. 97. U.S. Social Gaming Social gaming revenues (via the Internet) in billions of dollars from 2010 to 2015 were modeled by R(x) = 0.86x + 1.2, where x represents years after 2010. (Source: Bl Intelligence.) a. O Interpret the slope of the graph of R. b. Estimate when revenue was more than $3 billion. 98. Overweight Americans If trends continue, the past and future percentages of the population who are overweight can be estimated by W(x) = x + 45, where x represents years after 1980. (Source: New York Times.) a. & 7 000000_7114 [P70010134770000000DOURDOO 0 30 * 8 O 9 ✓ ) QAA F 0 4 < 133 890 + L www X 7.59 6 backspace
b Math for X bra Week ook S d C $ www K 78 99 120 135 153 168 172 + % 5 6 What does the x-intercept on the graph of y = T(X) represent? c. Solve part (a) symbolically. 97. U.S. Social Gaming Social gaming revenues (via the Internet) in billions of dollars from 2010 to 2015 were modeled by R(x) = 0.86x + 1.2, where x represents years after 2010. (Source: Bl Intelligence.) a. O Interpret the slope of the graph of R. b. Estimate when revenue was more than $3 billion. 98. Overweight Americans If trends continue, the past and future percentages of the population who are overweight can be estimated by W(x) = x + 45, where x represents years after 1980. (Source: New York Times.) a. & 7 000000_7114 [P70010134770000000DOURDOO 0 30 * 8 O 9 ✓ ) QAA F 0 4 < 133 890 + L www X 7.59 6 backspace

Algebra & Trigonometry with Analytic Geometry
13th Edition
ISBN:9781133382119
Author:Swokowski
Publisher:Swokowski
Chapter3: Functions And Graphs
Section3.3: Lines
Problem 55E

Related questions
Question
Transcribed Image Text:b Math for X
bra
Week
ook
S
d
C
$
www
K
78
99
120
135
153
168
172
+
%
5
6
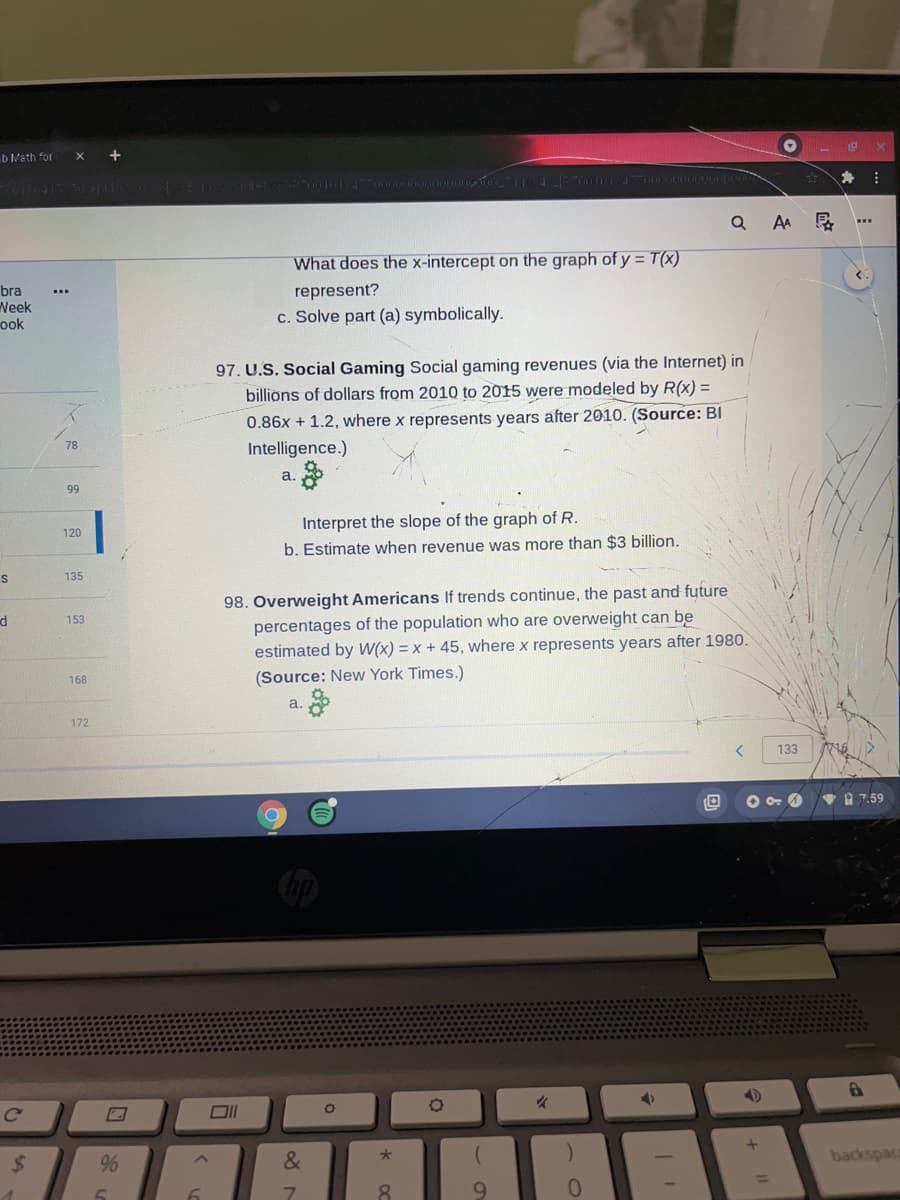
What does the x-intercept on the graph of y = T(X)
represent?
c. Solve part (a) symbolically.
97. U.S. Social Gaming Social gaming revenues (via the Internet) in
billions of dollars from 2010 to 2015 were modeled by R(x) =
0.86x + 1.2, where x represents years after 2010. (Source: Bl
Intelligence.)
a.
O
Interpret the slope of the graph of R.
b. Estimate when revenue was more than $3 billion.
98. Overweight Americans If trends continue, the past and future
percentages of the population who are overweight can be
estimated by W(x) = x + 45, where x represents years after 1980.
(Source: New York Times.)
a.
&
7
000000_7114 [P70010134770000000DOURDOO
0
30 *
8
O
9
✓
)
QAA F
0
4
<
133
890
+
L
www
X
7.59
6
backspace
Expert Solution
This question has been solved!
Explore an expertly crafted, step-by-step solution for a thorough understanding of key concepts.

Step by step
Solved in 3 steps

Recommended textbooks for you
Algebra & Trigonometry with Analytic Geometry
Algebra
ISBN:
9781133382119
Author:
Swokowski
Publisher:
Cengage

College Algebra
Algebra
ISBN:
9781305115545
Author:
James Stewart, Lothar Redlin, Saleem Watson
Publisher:
Cengage Learning

Algebra & Trigonometry with Analytic Geometry
Algebra
ISBN:
9781133382119
Author:
Swokowski
Publisher:
Cengage
College Algebra
Algebra
ISBN:
9781305115545
Author:
James Stewart, Lothar Redlin, Saleem Watson
Publisher:
Cengage Learning

Glencoe Algebra 1, Student Edition, 9780079039897…
Algebra
ISBN:
9780079039897
Author:
Carter
Publisher:
McGraw Hill