The graph of a sinusoidal function is shown. (A) Determine the amplitude, period, equation of the midline, the range and phase shift. 90 180° 270° 360° -1 -2 Use the information from part (A) to determine a function that represents the graph in the (B) the form y = = acos b(x – c) + d. Ing
The graph of a sinusoidal function is shown. (A) Determine the amplitude, period, equation of the midline, the range and phase shift. 90 180° 270° 360° -1 -2 Use the information from part (A) to determine a function that represents the graph in the (B) the form y = = acos b(x – c) + d. Ing

Algebra & Trigonometry with Analytic Geometry
13th Edition
ISBN:9781133382119
Author:Swokowski
Publisher:Swokowski
Chapter6: The Trigonometric Functions
Section6.5: Trigonometric Graphs
Problem 9E

Related questions
Topic Video
Question
Please help, thank you
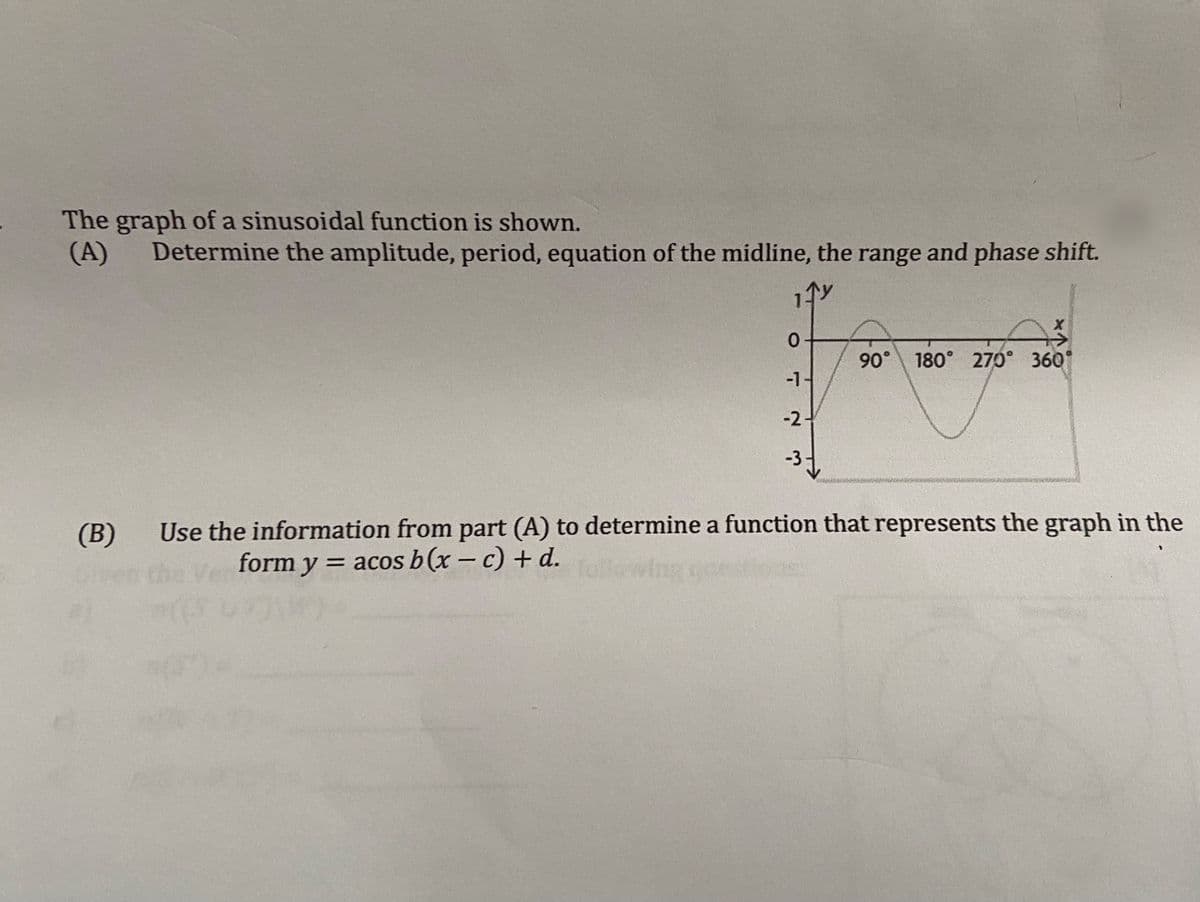
Transcribed Image Text:The graph of a sinusoidal function is shown.
(A)
Determine the amplitude, period, equation of the midline, the range and phase shift.
90 180° 270° 360°
-1
-2
Use the information from part (A) to determine a function that represents the graph in the
(B)
the
form y =
= acos b(x – c) + d.
Ing
Expert Solution
This question has been solved!
Explore an expertly crafted, step-by-step solution for a thorough understanding of key concepts.

Step by step
Solved in 4 steps

Knowledge Booster


Learn more about
Need a deep-dive on the concept behind this application? Look no further. Learn more about this topic, advanced-math and related others by exploring similar questions and additional content below.Recommended textbooks for you
Algebra & Trigonometry with Analytic Geometry
Algebra
ISBN:
9781133382119
Author:
Swokowski
Publisher:
Cengage
Algebra & Trigonometry with Analytic Geometry
Algebra
ISBN:
9781133382119
Author:
Swokowski
Publisher:
Cengage