An article in Quality Engineering presents viscosity data from a batch chemical process. A sample of these data is in the table. Reading left to right and up to down, draw a time series plot of all the data and comment on any features of the data that are revealed by this plot. Consider that the first 40 observations (the first 4 columns) were generated from a specific process, whereas the last 40 observations were generated from a different process. Does the plot indicate that the two processes generate similar results? Calculate the sample mean and sample
An article in Quality Engineering presents viscosity data from a batch chemical process. A sample of these data is in the table. Reading left to right and up to down, draw a time series plot of all the data and comment on any features of the data that are revealed by this plot. Consider that the first 40 observations (the first 4 columns) were generated from a specific process, whereas the last 40 observations were generated from a different process. Does the plot indicate that the two processes generate similar results? Calculate the sample mean and sample

A First Course in Probability (10th Edition)
10th Edition
ISBN:9780134753119
Author:Sheldon Ross
Publisher:Sheldon Ross
Chapter1: Combinatorial Analysis
Section: Chapter Questions
Problem 1.1P: a. How many different 7-place license plates are possible if the first 2 places are for letters and...

Related questions
Question
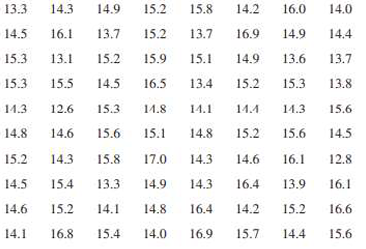
An article in Quality Engineering presents viscosity data from a batch chemical process. A sample of these data is in the table. Reading left to right and up to down, draw a time series plot of all the data and comment on any features of the data that are revealed by this plot.
Consider that the first 40 observations (the first 4 columns) were generated from a specific process, whereas the last 40 observations were generated from a different process. Does the plot indicate that the two processes generate similar results?
Calculate the sample mean and sample variance of the first 40 and the second 40 observations.
Transcribed Image Text:13.3
14.3
14.9
15.2
15.8
14.2
16.0
14.0
14.5
16.1
13.7
15.2
13.7
16.9
14.9
14.4
15.3
13.1
15.2
15.9
15.1
14.9
13.6
13.7
15.3
15.5
14.5
16.5
13.4
15.2
15.3
13.8
14.3
12.6
15.3
14.8
14.1
14.4
14.3
15.6
14.8
14.6
15.6
15.1
14.8
15.2
15.6
14.5
15.2
14.3
15.8
17.0
14.3
14.6
16.1
12.8
14.5
15.4
13.3
14.9
14.3
16.4
13.9
16.1
14.6
15.2
14.1
14.8
16.4
14.2
15.2
16.6
14.1
16.8
15.4
14.0
16.9
15.7
14.4
15.6
Expert Solution
This question has been solved!
Explore an expertly crafted, step-by-step solution for a thorough understanding of key concepts.

Step by step
Solved in 2 steps with 5 images

Recommended textbooks for you
A First Course in Probability (10th Edition)
Probability
ISBN:
9780134753119
Author:
Sheldon Ross
Publisher:
PEARSON

A First Course in Probability (10th Edition)
Probability
ISBN:
9780134753119
Author:
Sheldon Ross
Publisher:
PEARSON