An automobile tire manufacturer collected the data in the table relating tire pressure x (in pounds per square inch) and mileage (in thousands of miles). Use quadratic regression on a graphing utility to find the quadratic function f(x) that best fits the data. -²0 (Round to three decimal places as needed) CTO 30 32 34 Mileage 45 62 56 50 46
An automobile tire manufacturer collected the data in the table relating tire pressure x (in pounds per square inch) and mileage (in thousands of miles). Use quadratic regression on a graphing utility to find the quadratic function f(x) that best fits the data. -²0 (Round to three decimal places as needed) CTO 30 32 34 Mileage 45 62 56 50 46

Chapter3: Polynomial Functions
Section: Chapter Questions
Problem 18T

Related questions
Question
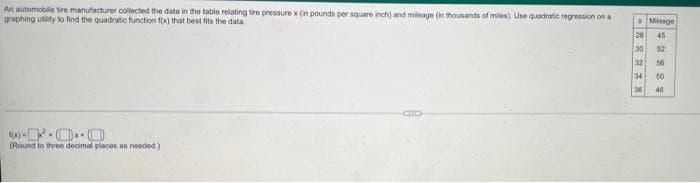
Transcribed Image Text:An automobile tire manufacturer collected the data in the table relating tire pressure x (in pounds per square inch) and mileage (in thousands of mies). Use quadratic regression on a
graphing utility to find the quadratic function f(x) that best fits the data.
(x)-²-**
(Round to three decimal places as needed)
28
30
Mileage
45
58835
29
32 56
34 50
34
46
Expert Solution
This question has been solved!
Explore an expertly crafted, step-by-step solution for a thorough understanding of key concepts.

Step by step
Solved in 2 steps with 1 images

Recommended textbooks for you

Algebra & Trigonometry with Analytic Geometry
Algebra
ISBN:
9781133382119
Author:
Swokowski
Publisher:
Cengage
Algebra & Trigonometry with Analytic Geometry
Algebra
ISBN:
9781133382119
Author:
Swokowski
Publisher:
Cengage