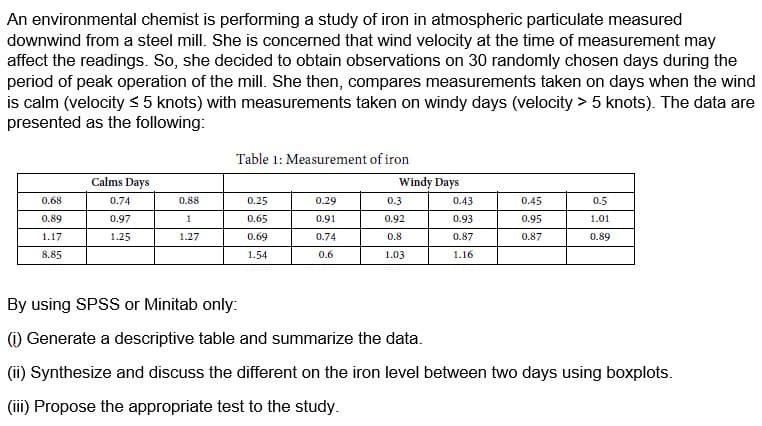
An environmental chemist is performing a study of iron in atmospheric particulate measured downwind from a steel mill. She is concerned that wind velocity at the time of measurement may affect the readings. So, she decided to obtain observations on 30 randomly chosen days during the period of peak operation of the mill. She then, compares measurements taken on days when the wind is calm (velocity ≤ 5 knots) with measurements taken on windy days (velocity > 5 knots). The data are presented as the following:
An environmental chemist is performing a study of iron in atmospheric particulate measured downwind from a steel mill. She is concerned that wind velocity at the time of measurement may affect the readings. So, she decided to obtain observations on 30 randomly chosen days during the period of peak operation of the mill. She then, compares measurements taken on days when the wind is calm (velocity ≤ 5 knots) with measurements taken on windy days (velocity > 5 knots). The data are presented as the following:

Algebra & Trigonometry with Analytic Geometry
13th Edition
ISBN:9781133382119
Author:Swokowski
Publisher:Swokowski
Chapter7: Analytic Trigonometry
Section7.6: The Inverse Trigonometric Functions
Problem 91E

Related questions
Question
Transcribed Image Text:An environmental chemist is performing a study of iron in atmospheric particulate measured
downwind from a steel mill. She is concerned that wind velocity at the time of measurement may
affect the readings. So, she decided to obtain observations on 30 randomly chosen days during the
period of peak operation of the mill. She then, compares measurements taken on days when the wind
is calm (velocity ≤ 5 knots) with measurements taken on windy days (velocity > 5 knots). The data are
presented as the following:
Table 1: Measurement of iron
Calms Days
Windy Days
0.68
0.74
0.88
0.25
0.29
0.3
0.43
0.45
0.5
0.89
0.97
1
0.65
0.91
0.92
0.93
0.95
1.01
1.17
1.25
1.27
0.69
0.74
0.8
0.87
0.87
0.89
8.85
1.54
0.6
1.03
1.16
By using SPSS or Minitab only:
(1) Generate a descriptive table and summarize the data.
(ii) Synthesize and discuss the different on the iron level between two days using boxplots.
(iii) Propose the appropriate test to the study.
Expert Solution
This question has been solved!
Explore an expertly crafted, step-by-step solution for a thorough understanding of key concepts.

Step by step
Solved in 5 steps with 3 images

Recommended textbooks for you
Algebra & Trigonometry with Analytic Geometry
Algebra
ISBN:
9781133382119
Author:
Swokowski
Publisher:
Cengage

Trigonometry (MindTap Course List)
Trigonometry
ISBN:
9781305652224
Author:
Charles P. McKeague, Mark D. Turner
Publisher:
Cengage Learning
Algebra & Trigonometry with Analytic Geometry
Algebra
ISBN:
9781133382119
Author:
Swokowski
Publisher:
Cengage
Trigonometry (MindTap Course List)
Trigonometry
ISBN:
9781305652224
Author:
Charles P. McKeague, Mark D. Turner
Publisher:
Cengage Learning