An experiment in a wind tunnel generates cyclic waves. The following data is collected for 56 seconds: Wind speed (in se conds) (in feet per second) Time 16 14 41 28 66 42 41 56 16 Let V represent the wind speed (velocity) in feet per second and let t represent the time in seconds. (a) Write a function that describes the wave. (b) Sketch a graph of the function.
An experiment in a wind tunnel generates cyclic waves. The following data is collected for 56 seconds: Wind speed (in se conds) (in feet per second) Time 16 14 41 28 66 42 41 56 16 Let V represent the wind speed (velocity) in feet per second and let t represent the time in seconds. (a) Write a function that describes the wave. (b) Sketch a graph of the function.

Algebra & Trigonometry with Analytic Geometry
13th Edition
ISBN:9781133382119
Author:Swokowski
Publisher:Swokowski
Chapter9: Systems Of Equations And Inequalities
Section9.1: Systems Of Equations
Problem 67E

Related questions
Question
Could you please write the answers clearly and understandably? Thank you
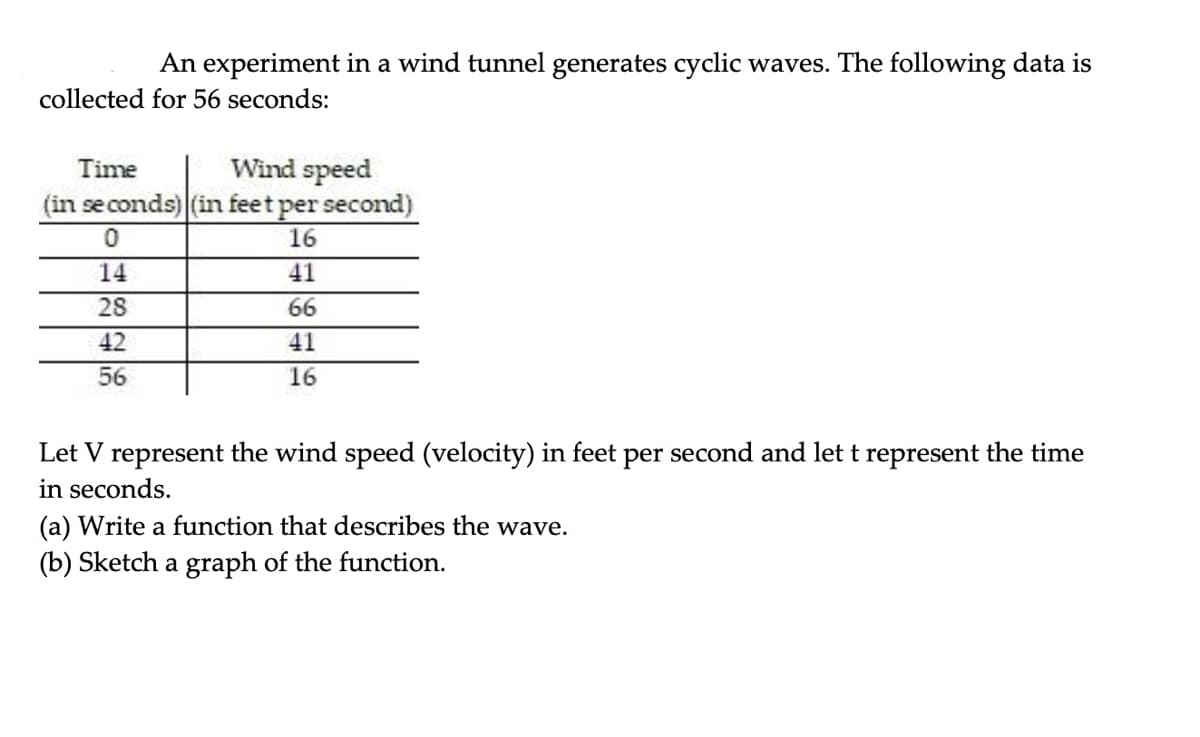
Transcribed Image Text:An experiment in a wind tunnel generates cyclic waves. The following data is
collected for 56 seconds:
Wind speed
(in se conds) (in feet per second)
Time
16
14
41
28
66
42
41
56
16
Let V represent the wind speed (velocity) in feet per second and let t represent the time
in seconds.
(a) Write a function that describes the wave.
(b) Sketch a graph of the function.
Expert Solution
This question has been solved!
Explore an expertly crafted, step-by-step solution for a thorough understanding of key concepts.

This is a popular solution!

Trending now
This is a popular solution!

Step by step
Solved in 3 steps with 2 images

Recommended textbooks for you
Algebra & Trigonometry with Analytic Geometry
Algebra
ISBN:
9781133382119
Author:
Swokowski
Publisher:
Cengage
Algebra & Trigonometry with Analytic Geometry
Algebra
ISBN:
9781133382119
Author:
Swokowski
Publisher:
Cengage